Relative Strength Index (RSI)
The Relative Strength Index (RSI), developed by J. Welles Wilder Jr., is a versatile momentum oscillator that measures the speed and magnitude of recent price changes. It does this by comparing the average size of upward price moves to the average size of downward price moves over a specified period. The resulting value oscillates between 0 and 100, and is primarily used to identify overbought (typically above 70) and oversold (typically below 30) conditions in the market, which can signal potential price reversals.
RSI
=RSI(data, period) Example Usage
=RSI(A2:F500, 14)
Parameters
| Parameter | Type | Description | Status |
|---|---|---|---|
data | Range | Range of columns containing the date, Open, high, Low, close, volume data. | Required |
period | Number | Number of periods (days) over which the RSI is calculated. | Required |
Returns
A two-column array of dates and their corresponding RSI values.
Output Example
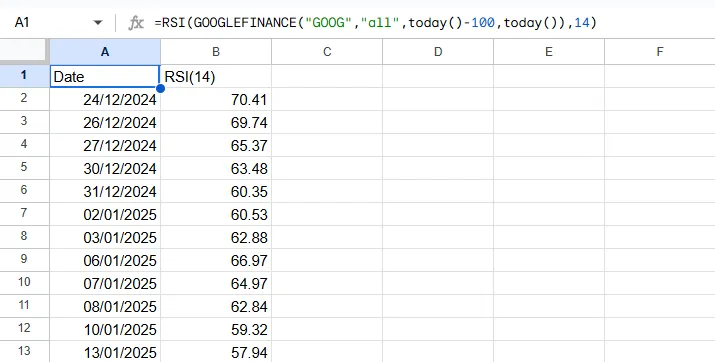
Source Code
Copy the following code into your Apps Script editor (Extensions > Apps Script) to use the RSI function in your spreadsheet.
rsi.js
/**
 * Calculates the Relative Strength Index (RSI) for a given dataset and period.
 *
 * @param {array} data - An array of historical stock data. Can be a single column of prices or a multi-column array from GOOGLEFINANCE.
 * @param {number} period The number of periods to calculate the RSI, e.g., 14 for a 14-day RSI.
 * @returns {array} A 2D array with headers: Date and RSI.
 * @customfunction
 */
function RSI(data, period) {
  // Argument validation
  if (arguments.length !== 2) {
    throw new Error(`Wrong number of arguments. Expected 2, but got ${arguments.length}.`);
  }
  if (typeof period !== 'number' || period <= 0 || !Number.isInteger(period)) {
    throw new Error(`Invalid period. The period must be a positive integer. Got: ${period}`);
  }

  const processedData = getData(data);

  // --- NEW: Function-level validation ---
  const columnCount = processedData[0].length;
  if (columnCount > 2 && columnCount < 5) {
      throw new Error(`Invalid data structure for RSI. For multi-column data, expected at least 5 columns (Date, O, H, L, C), but got ${columnCount}. For simple data, expected 2 columns (Date, Value).`);
  }
  // --- END of validation ---

  const dates = processedData.slice(1).map(row => row[0]);
  const values = getValues(processedData);

  if (period >= values.length) {
    throw new Error(`Invalid period. The period (${period}) cannot be greater than or equal to the number of data points (${values.length}).`);
  }

  let gainsData = []; // 2D array: [[date, gain], ...]
  let lossesData = []; // 2D array: [[date, loss], ...]

  // Note: gains and losses are calculated from the second data point (index 1)
  // So, their dates correspond to dates[i] where i starts from 1.
  for (let i = 1; i < values.length; i++) {
    let priceChange = values[i] - values[i - 1];
    // The date for this change is dates[i]
    if (priceChange > 0) {
      gainsData.push([dates[i], priceChange]);
      lossesData.push([dates[i], 0]);
    } else {
      gainsData.push([dates[i], 0]);
      lossesData.push([dates[i], Math.abs(priceChange)]);
    }
  }

  // RMA now takes 2D array data and returns 2D array data
  const avgGainsResult = RMA(gainsData, period);
  const avgLossesResult = RMA(lossesData, period);

  // Extract values from RMA results (remove headers)
  const avgGains = avgGainsResult.slice(1).map(row => row[1]);
  const avgLosses = avgLossesResult.slice(1).map(row => row[1]);

  let results = [['Date', `RSI(${period})`]];

  // The dates for avgGains and avgLosses are already aligned by RMA.
  // We need to use the dates from avgGainsResult (or avgLossesResult) for the final RSI output.
  // The loop should start from the first available RSI value.
  // The length of avgGains and avgLosses will be (values.length - 1) - (period - 1) = values.length - period
  // The dates for these results start from dates[period] in the original series.

  for (let i = 0; i < avgGains.length; i++) {
    const date = avgGainsResult[i + 1][0]; // +1 to skip header
    const avgGain = avgGains[i];
    const avgLoss = avgLosses[i];

    if (avgLoss === 0) {
        results.push([date, 100]);
        continue;
    }

    const rs = avgGain / avgLoss;
    const rsi = 100 - (100 / (1 + rs));
    results.push([date, rsi]);
  }

  return results;
}