Money Flow Index (MFI)
The Money Flow Index (MFI) is a momentum indicator that incorporates both price and volume data to measure buying and selling pressure. Often referred to as the “volume-weighted RSI,” the MFI is used to identify overbought or oversold conditions by analyzing the intensity of money flowing into and out of a security.
MFI
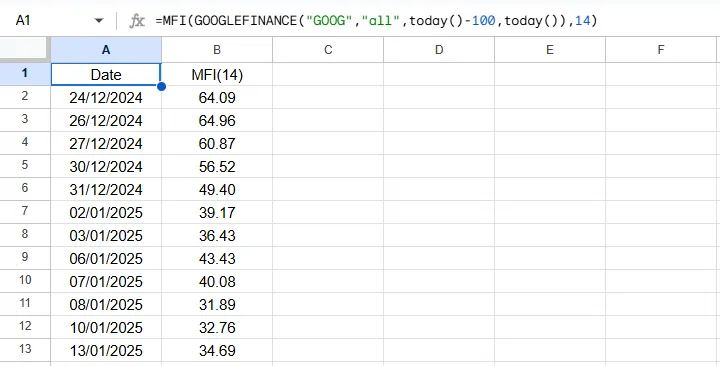
=MFI(data, period) Example Usage
=MFI(A2:F500, 14)
Parameters
| Parameter | Type | Description | Status |
|---|---|---|---|
data | Range | The input range of columns containing the Date, Open, High, Low, Close, and Volume data. | Required |
period | Number | The number of periods to calculate the MFI. Default is 14. | Optional |
Returns
A two-column array of dates and their corresponding MFI values.
Source Code
Copy the following code into your Apps Script editor (Extensions > Apps Script) to use the MFI function in your spreadsheet.
mfi.js
/**
 * Calculates the Money Flow Index (MFI) for a given dataset and period.
 *
 * @param {array} data - An array of historical stock data. Expected to have at least 6 columns (Date, Open, High, Low, Close, Volume).
 * @param {number} period - The number of periods for calculating the MFI.
 * @returns {array} - A 2D array with headers: Date, MFI.
 * @customfunction
 */
function MFI(data, period) {
  // Argument validation
  if (arguments.length !== 2) {
    throw new Error(`Wrong number of arguments. Expected 2, but got ${arguments.length}.`);
  }
  if (typeof period !== 'number' || period <= 0 || !Number.isInteger(period)) {
    throw new Error(`Invalid period. The period must be a positive integer. Got: ${period}`);
  }

  const processedData = getData(data);

  // --- NEW: Function-level validation ---
  const columnCount = processedData[0].length;
  if (columnCount < 6) {
    throw new Error(`Invalid data structure for MFI. Expected at least 6 columns (Date, Open, High, Low, Close, Volume), but got ${columnCount}.`);
  }
  // --- END of validation ---

  const dates = processedData.slice(1).map(row => row[0]);
  const highs = processedData.slice(1).map(row => row[2]);
  const lows = processedData.slice(1).map(row => row[3]);
  const closes = processedData.slice(1).map(row => row[4]);
  const volumes = processedData.slice(1).map(row => row[5]);

  if (period > closes.length) {
    throw new Error(`Invalid period. The period (${period}) cannot be greater than the number of data points (${closes.length}).`);
  }
  if (closes.length < period + 1) { // Need at least period + 1 data points for comparison (current vs previous TP)
      throw new Error(`Insufficient data for MFI. At least ${period + 1} data points are required for the specified period.`);
  }

  const mfiValues = [["Date", `MFI(${period})`]];

  const typicalPrices = closes.map((close, i) => (highs[i] + lows[i] + close) / 3);
  const moneyFlows = typicalPrices.map((tp, i) => tp * volumes[i]);

  for (let i = period; i < typicalPrices.length; i++) { // Start from 'period' to ensure previousTP is available
    let positiveFlow = 0;
    let negativeFlow = 0;

    for (let j = 0; j < period; j++) {
      const currentTP = typicalPrices[i - j];
      const previousTP = typicalPrices[i - j - 1];

      if (currentTP > previousTP) {
        positiveFlow += moneyFlows[i - j];
      } else if (currentTP < previousTP) {
        negativeFlow += moneyFlows[i - j];
      }
    }

    let moneyFlowRatio;
    if (negativeFlow === 0) {
        moneyFlowRatio = Infinity; // Handle division by zero for negativeFlow
    } else {
        moneyFlowRatio = positiveFlow / negativeFlow;
    }

    const mfi = 100 - (100 / (1 + moneyFlowRatio));

    mfiValues.push([dates[i], mfi]);
  }

  return mfiValues;
}