Aroon Indicator
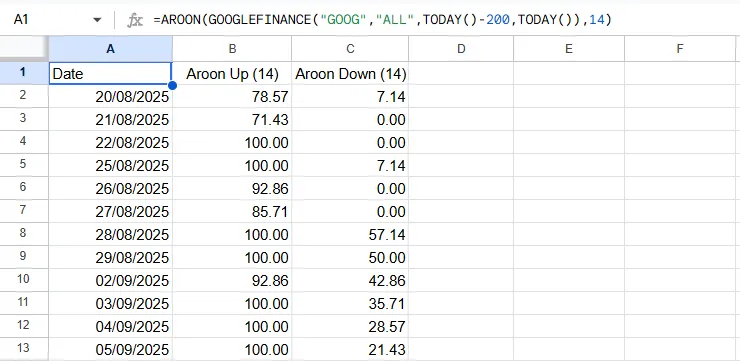
The Aroon indicator is used to identify whether a security is trending and the strength of the trend. It consists of two lines: “Aroon Up” measures how long it has been since the highest high, and “Aroon Down” measures how long it has been since the lowest low.
AROON
=AROON(data, period) Example Usage
=AROON(A2:F500, 25)
Parameters
| Parameter | Type | Description | Status |
|---|---|---|---|
data | Range | The input range of columns containing the Date, Open, High, Low, Close, and Volume data. | Required |
period | Number | The lookback period. Default is 25. | Optional |
Returns
A multi-column array containing:
- Date
- Aroon Up: (periods since high / period) * 100.
- Aroon Down: (periods since low / period) * 100.
Source Code
Copy the following code into your Apps Script editor (Extensions > Apps Script) to use the AROON function in your spreadsheet.
aroon.js
/**
 * Calculates the Aroon Indicator (Aroon Up, Aroon Down).
 * Aroon Up = ((period - Days Since N-day High) / period) * 100
 * Aroon Down = ((period - Days Since N-day Low) / period) * 100
 *
 * @param {array} data - The input range. Must include at least 4 columns: Date, Open, High, Low.
 * @param {number} [period=25] - The lookback period (default 25).
 * @returns {array} A multi-column array with headers "Date", "Aroon Up", "Aroon Down".
 * @customfunction
 */
function AROON(data, period = 25) {
    checkPremium();

    // Argument validation
    if (arguments.length < 1 || arguments.length > 2) {
        throw new Error(`Wrong number of arguments. Expected 1 or 2, but got ${arguments.length}.`);
    }
    if (period !== undefined) {
        if (typeof period !== 'number' || period <= 0 || !Number.isInteger(period)) {
            throw new Error(`Invalid period. The period must be a positive integer. Got: ${period}`);
        }
    }

    const processedData = getData(data);

    // --- Validate Data Structure ---
    const columnCount = processedData[0].length;
    if (columnCount < 4) {
        throw new Error(`Invalid data structure. Expected at least 4 columns (Date, O, H, L), but got ${columnCount}.`);
    }

    const dataRows = processedData.slice(1);
    const results = [["Date", `Aroon Up (${period})`, `Aroon Down (${period})`]];

    // We need a buffer of past Highs and Lows of size (period + 1) to find "days since".
    // Actually, we need to look back 'period' days.
    // The formula usually implies looking relatively.

    const highBuffer = [];
    const lowBuffer = [];

    for (let i = 0; i < dataRows.length; i++) {
        const row = dataRows[i];
        const date = row[0];
        const high = row[2];
        const low = row[3];

        highBuffer.push(high);
        lowBuffer.push(low);

        // Maintain buffer size: period + 1 (to include current? Or just period?)
        // Standard: Lookback period days.
        if (highBuffer.length > period + 1) {
            highBuffer.shift();
            lowBuffer.shift();
        }

        if (highBuffer.length < period + 1) {
            results.push([date, "", ""]);
            continue;
        }

        // Find index of Max High and Min Low in the buffer
        // The buffer represents a window. Last element is "0 days ago".
        // We need "Days Since".
        // If max is at index `len - 1` (current), days since = 0.
        // If max is at index `0` (oldest), days since = period.

        let maxHigh = -Infinity;
        let minLow = Infinity;
        let maxIndex = -1;
        let minIndex = -1;

        // Iterate buffer
        for (let j = 0; j < highBuffer.length; j++) {
            if (highBuffer[j] >= maxHigh) {
                // Note regarding ties: usually most recent? Or oldest?
                // Standard: "Number of periods since the highest high".
                // Usually means most recent high if equal?
                // TradingView: `highestbars(high, length)` returns offset.
                // Let's assume most recent to restart the count.
                maxHigh = highBuffer[j];
                maxIndex = j;
            }
            if (lowBuffer[j] <= minLow) {
                minLow = lowBuffer[j];
                minIndex = j;
            }
        }

        // Calculate Days Since
        // buffer length is period + 1.
        // Index 0 is 'period' ago. Index 'period' is 0 ago.
        // Days Since = (buffer.length - 1) - Index.

        const daysSinceHigh = (highBuffer.length - 1) - maxIndex;
        const daysSinceLow = (lowBuffer.length - 1) - minIndex;

        const aroonUp = ((period - daysSinceHigh) / period) * 100;
        const aroonDown = ((period - daysSinceLow) / period) * 100;

        results.push([date, aroonUp, aroonDown]);
    }

    // Trim Output
    let firstValidIndex = -1;
    for (let i = 1; i < results.length; i++) {
        // Check both columns? Usually they come valid together.
        if (results[i][1] !== "" && results[i][1] !== null) {
            firstValidIndex = i;
            break;
        }
    }

    if (firstValidIndex !== -1) {
        return [results[0], ...results.slice(firstValidIndex)];
    } else {
        return [results[0]];
    }
}