Bollinger Bands (BB)
Bollinger Bands are a technical analysis tool developed by John Bollinger, consisting of three lines plotted in relation to a security’s price. The middle line is a Simple Moving Average (SMA), while the upper and lower bands are typically set two standard deviations above and below the SMA. The primary purpose of Bollinger Bands is to measure market volatility by showing how the bands widen during periods of high volatility and contract (or ‘squeeze’) during periods of low volatility.
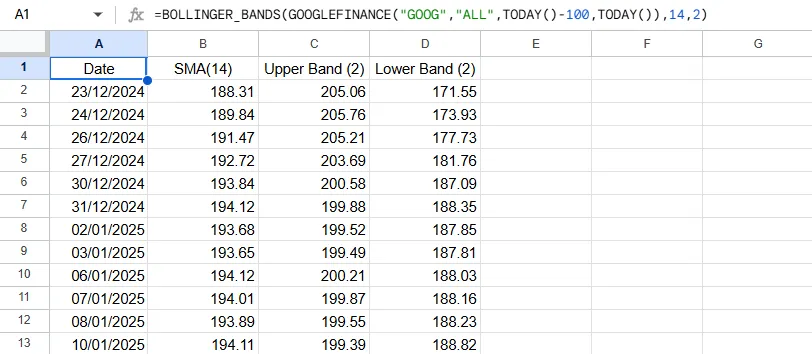
BOLLINGER_BANDS
=BOLLINGER_BANDS(data, period, multiplier) Example Usage
=BOLLINGER_BANDS(A2:F500, 20, 2)
Parameters
| Parameter | Type | Description | Status |
|---|---|---|---|
data | Range | The input range of columns containing the Date, Open, High, Low, Close, and Volume data. | Required |
period | Number | The number of periods (days) used to calculate the Simple Moving Average and standard deviation. Typically **20** periods. | Required |
multiplier | Number | The multiplier applied to the standard deviation to set the width of the bands. Typically **2**. | Required |
Returns
A four-column array of dates and their corresponding SMA, Upper Band and Lower Band values.
Source Code
Copy the following code into your Apps Script editor (Extensions > Apps Script) to use the BOLLINGER-BANDS function in your spreadsheet.
bollingerBands.js
/**
 * Calculates Bollinger Bands (SMA, Upper Band, Lower Band).
 *
 * @param {array} data - The input range. Can be a multi-column range (Date, Open, High, Low, Close, Volume) or a two-column range (Date, Value).
 * @param {number} period - The period for the SMA (middle band), typically 20.
 * @param {number} multiplier - The standard deviation multiplier for the bands, typically 2.
 * @returns {array} A multi-column array with headers: Date, SMA, Upper Band, Lower Band.
 * @customfunction
 */
function BOLLINGER_BANDS(data, period, multiplier) {
  // Argument validation
  if (arguments.length !== 3) {
    throw new Error(`Wrong number of arguments. Expected 3, but got ${arguments.length}.`);
  }
  if (typeof period !== 'number' || period <= 0 || !Number.isInteger(period)) {
    throw new Error(`Invalid period. The period must be a positive integer. Got: ${period}`);
  }
  if (typeof multiplier !== 'number' || multiplier <= 0) {
    throw new Error(`Invalid multiplier. The multiplier must be a positive number. Got: ${multiplier}`);
  }

  // Calculate the SMA (middle band)
  const smaValues = SMA(data, period).slice(1); // Remove headers

  // Calculate the standard deviation using STDEV_INDICATOR
  const stdevValues = STDEV_INDICATOR(data, period).slice(1); // Remove headers

  // Initialize Bollinger Bands array with headers
  const bollingerBands = [["Date", `SMA(${period})`, `Upper Band (${multiplier})`, `Lower Band (${multiplier})`]];

  // Combine SMA and standard deviation to calculate upper and lower bands
  for (let i = 0; i < smaValues.length; i++) {
    const date = smaValues[i][0];
    const sma = smaValues[i][1];
    const stdDev = stdevValues[i][1]; // Standard Deviation value

    // Calculate Upper and Lower Bands
    const upperBand = sma + (multiplier * stdDev);
    const lowerBand = sma - (multiplier * stdDev);

    // Append the results to the Bollinger Bands array
    bollingerBands.push([date, sma, upperBand, lowerBand]);
  }

  return bollingerBands;
}