Volume Weighted Average Price (VWAP)
Volume-Weighted Average Price (VWAP) is a technical indicator that calculates the average price a security has traded at throughout a period, weighted by both volume and price. It serves as a benchmark for traders and institutions to determine trend direction, liquidity, and fair value.
Key Aspects
- Bullish Sentiment: Price > VWAP indicates an upward trend.
- Bearish Sentiment: Price < VWAP indicates a downward trend.
- Usage: Frequently used for identifying dynamic support/resistance and assessing execution quality.
VWAP
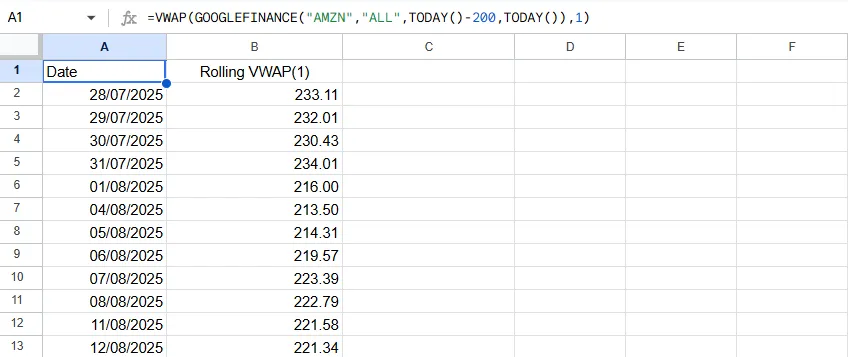
=VWAP(data, [period]) Example Usage
=VWAP(A2:F500) // Cumulative (Anchored) from start
=VWAP(A2:F500, 20) // Rolling 20-period VWAP
Parameters
| Parameter | Type | Description | Status |
|---|---|---|---|
data | Range | The input range of columns containing the Date, Open, High, Low, Close, and Volume data. | Required |
period | Number | Optional. The number of periods for a **Rolling VWAP** (e.g., 20). If omitted, calculates **Cumulative (Anchored) VWAP** from the start of the data. | Optional |
Return Value
A two-column array of dates and their corresponding VWAP values.
💡 Anchored vs. Rolling VWAP
Anchored VWAP (Default): When you omit the period, the formula calculates a cumulative average starting from the first row of your data range. This is equivalent to an Anchored VWAP tied to the start of your dataset. It does not reset daily like an intraday Session VWAP.
Rolling VWAP: When you provide a period (e.g., 20), the formula uses a sliding window (e.g., last 20 days). This eliminates the long-term “drift” of the cumulative calculation and makes the indicator responsive to recent price action, similar to a Moving Average but volume-weighted.
Source Code
Copy the following code into your Apps Script editor (Extensions > Apps Script) to use the VWAP function in your spreadsheet.
/**
 * Calculates the Cumulative Volume Weighted Average Price (VWAP).
 * VWAP provides the average price a stock has traded at throughout the day/period, based on both volume and price.
 *
 * @param {array} data - The input range. Must include 6 columns: Date, Open, High, Low, Close, and Volume.
 * @param {number} [period] - Optional. The number of periods for a **Rolling VWAP**. If omitted, calculates **Cumulative (Anchored) VWAP** from the start.
 * @returns {array} A two-column array with headers "Date" and "VWAP".
 * @customfunction
 */
function VWAP(data, period) {
    checkPremium();

  // Argument validation
  if (arguments.length < 1 || arguments.length > 2) {
    throw new Error(`Wrong number of arguments. Expected 1 or 2, but got ${arguments.length}.`);
  }
  if (period !== undefined) {
    if (typeof period !== 'number' || period <= 0 || !Number.isInteger(period)) {
      throw new Error(`Invalid period. The period must be a positive integer. Got: ${period}`);
    }
  }

  const processedData = getData(data);

  // --- Function-level validation for DOHLCV data ---
  const columnCount = processedData[0].length;
  if (columnCount < 6) {
    throw new Error(`Invalid data structure for VWAP. Expected at least 6 columns (Date, O, H, L, C, V), but got ${columnCount}.`);
  }
  // --- END of validation ---

  const dataRows = processedData.slice(1);
  const results = [["Date", period ? `Rolling VWAP(${period})` : "Cumulative VWAP"]];

  // Variables for Cumulative mode
  let cumulativeTPV = 0;
  let cumulativeVolume = 0;

  // Variables for Rolling mode
  // We need to store individual TPV and Volume values to subtract them when they slide out of the window.
  const rollingTPVHistory = [];
  const rollingVolumeHistory = [];
  let rollingTPVSum = 0;
  let rollingVolumeSum = 0;

  for (let i = 0; i < dataRows.length; i++) {
    const row = dataRows[i];
    const date = row[0];
    const high = row[2];
    const low = row[3];
    const close = row[4];
    const volume = row[5];
    const typicalPrice = (high + low + close) / 3;

    // Handle zero volume or missing data
    if (volume === 0) {
      // Carry forward previous value or use Typical Price if first
      const vwap = i > 0 ? results[results.length - 1][1] : typicalPrice;
      results.push([date, vwap]);

      // For rolling window state maintenance, we push 0s so the window size is preserved
      if (period) {
        rollingTPVHistory.push(0);
        rollingVolumeHistory.push(0);
        if (rollingTPVHistory.length > period) {
          rollingTPVSum -= rollingTPVHistory.shift();
          rollingVolumeSum -= rollingVolumeHistory.shift();
        }
      }
      continue;
    }

    const tpv = typicalPrice * volume;

    if (period) {
      // --- ROLLING VWAP LOGIC ---
      rollingTPVHistory.push(tpv);
      rollingVolumeHistory.push(volume);
      rollingTPVSum += tpv;
      rollingVolumeSum += volume;

      if (rollingTPVHistory.length > period) {
        // Remove the oldest value
        rollingTPVSum -= rollingTPVHistory.shift();
        rollingVolumeSum -= rollingVolumeHistory.shift();
      }

      // Wait until we have enough data for the full period?
      // Standard practice often returns partials or starts at period.
      // Let's mirror SMA behavior: usually null until period, OR partial.
      // But for VWAP, partial (cumulative style up to period) is usually more useful than blanks.
      // Let's just calculate based on what we have in the window.

      const vwap = rollingTPVSum / rollingVolumeSum;
      results.push([date, vwap]);

    } else {
      // --- CUMULATIVE VWAP LOGIC (Anchored) ---
      cumulativeTPV += tpv;
      cumulativeVolume += volume;
      const vwap = cumulativeTPV / cumulativeVolume;
      results.push([date, vwap]);
    }
  }

  return results;
}