Mass Index
The Mass Index examines the range between the high and low prices to identify trend reversals based on range expansion. It identifies “reversal bulges” where the range expands beyond a certain threshold, often signaling a change in the current trend.
MASS
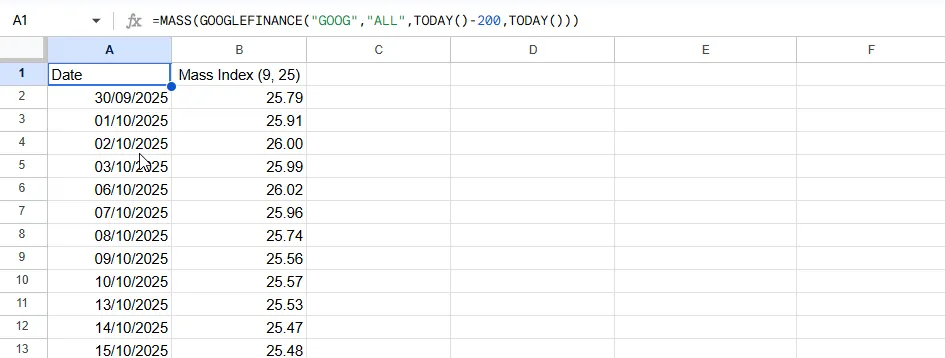
=MASS(data, emaPeriod, sumPeriod) Example Usage
=MASS(A2:F500, 9, 25)
Parameters
| Parameter | Type | Description | Status |
|---|---|---|---|
data | Range | The input range of columns containing the Date, Open, High, Low, Close, and Volume data. | Required |
emaPeriod | Number | The period for the Single and Double EMAs. Default is 9. | Optional |
sumPeriod | Number | The period for summing the EMA ratios. Default is 25. | Optional |
Returns
A two-column array of dates and their corresponding Mass Index values.
Source Code
Copy the following code into your Apps Script editor (Extensions > Apps Script) to use the MASS-INDEX function in your spreadsheet.
mass.js
/**
 * Calculates the Mass Index.
 * Identifies trend reversals based on range expansion.
 * Formula: Sum(EMA(High-Low, 9) / EMA(EMA(High-Low, 9), 9), 25)
 *
 * @param {array} data - The input range. Must include at least 4 columns: Date, Open, High, Low.
 * @returns {array} A two-column array with headers "Date" and "Mass Index".
 * @customfunction
 */
function MASS(data) {
    checkPremium();

    // Constants
    const emaLength = 9;
    const sumLength = 25;

    const processedData = getData(data);
    const columnCount = processedData[0].length;
    if (columnCount < 4) {
        throw new Error(`Invalid data structure.`);
    }

    const dataRows = processedData.slice(1);
    const results = [["Date", `Mass Index (${emaLength}, ${sumLength})`]];

    // Logic:
    // 1. Range = High - Low
    // 2. SingleEMA = EMA(Range, 9)
    // 3. DoubleEMA = EMA(SingleEMA, 9)
    // 4. Ratio = SingleEMA / DoubleEMA
    // 5. Mass Index = Sum(Ratio, 25)

    // EMA State
    const k = 2 / (emaLength + 1);

    let ema1 = 0; // Single
    let ema2 = 0; // Double

    const rangeBuffer = []; // For initializing EMA1
    let rangeSum = 0;

    const ema1Buffer = []; // For initializing EMA2
    let ema1Sum = 0; // Standard initialization sum? Only if using SMA init for Double.
    // Standard Double EMA usually treats the first SingleEMA value as the first point?
    // Or do we run a window?
    // Let's use standard initialization: First EMA = SMA.

    const ratioBuffer = []; // Sliding window of ratios for final Sum
    let ratioSum = 0;

    for (let i = 0; i < dataRows.length; i++) {
        const row = dataRows[i];
        const date = row[0];
        const high = row[2];
        const low = row[3];
        const range = high - low;

        // Calculate Single EMA
        let currentEma1 = null;
        if (rangeBuffer.length < emaLength) {
            rangeBuffer.push(range);
            rangeSum += range;
            if (rangeBuffer.length === emaLength) {
                ema1 = rangeSum / emaLength;
                currentEma1 = ema1;
            }
        } else {
            ema1 = (range * k) + (ema1 * (1 - k));
            currentEma1 = ema1;
        }

        // Calculate Double EMA
        let currentEma2 = null;
        if (currentEma1 !== null) {
            if (ema1Buffer.length < emaLength) {
                ema1Buffer.push(currentEma1);
                ema1Sum += currentEma1;
                if (ema1Buffer.length === emaLength) {
                    ema2 = ema1Sum / emaLength;
                    currentEma2 = ema2;
                }
            } else {
                ema2 = (currentEma1 * k) + (ema2 * (1 - k));
                currentEma2 = ema2;
            }
        }

        // Calculate Ratio and Sum
        if (currentEma1 !== null && currentEma2 !== null && currentEma2 !== 0) {
            const ratio = currentEma1 / currentEma2;

            ratioBuffer.push(ratio);
            ratioSum += ratio;

            if (ratioBuffer.length > sumLength) {
                ratioSum -= ratioBuffer.shift();
            }

            if (ratioBuffer.length === sumLength) {
                results.push([date, ratioSum]);
            } else {
                results.push([date, ""]);
            }
        } else {
            results.push([date, ""]);
        }
    }

    // Trim Output
    let firstValidIndex = -1;
    for (let i = 1; i < results.length; i++) {
        if (results[i][1] !== "" && results[i][1] !== null) {
            firstValidIndex = i;
            break;
        }
    }

    if (firstValidIndex !== -1) {
        return [results[0], ...results.slice(firstValidIndex)];
    } else {
        return [results[0]];
    }
}