Stochastic (STOCH)
The Stochastic Oscillator, developed by George C. Lane, is a popular momentum indicator that compares a particular closing price of a security to a range of its prices over a certain period of time. It is based on the premise that as prices rise, closing prices tend to be closer to the high of the recent range, and as prices fall, they tend to be closer to the low. The indicator oscillates between 0 and 100 and is primarily used to identify overbought (typically above 80) and oversold (typically below 20) conditions, which can signal potential momentum shifts and trend reversals..
STOCH
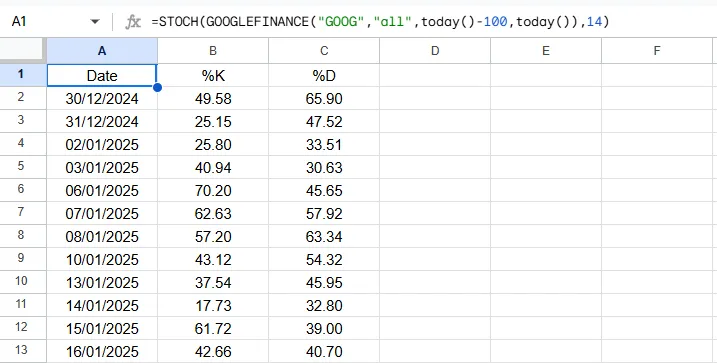
=STOCH(data, period) Example Usage
=STOCH(A2:F500, 14)
Parameters
| Parameter | Type | Description | Status |
|---|---|---|---|
data | Range | Range of columns containing the date, Open, high, Low, close, volume data. | Required |
period | Number | The number of periods (days) used to calculate the Stochastic Oscillator. | Required |
Returns
A three-column array of dates and their corresponding %K and %D values.
Source Code
Copy the following code into your Apps Script editor (Extensions > Apps Script) to use the STOCH function in your spreadsheet.
/**
 * Calculates the Stochastic Oscillator for a given dataset and period.
 *
 * @param {array} data An array of historical stock data. Expected to have at least 5 columns (Date, Open, High, Low, Close).
 * @param {number} period - The number of periods for calculating the Stochastic Oscillator.
 * @returns {array} - A 2D array with headers: Date, %K, %D.
 * @customfunction
 */
function STOCH(data, period) {
  // Argument validation
  if (arguments.length !== 2) {
    throw new Error(`Wrong number of arguments. Expected 2, but got ${arguments.length}.`);
  }
  if (typeof period !== 'number' || period <= 0 || !Number.isInteger(period)) {
    throw new Error(`Invalid period. The period must be a positive integer. Got: ${period}`);
  }

  const processedData = getData(data);

  // --- NEW: Function-level validation ---
  const columnCount = processedData[0].length;
  if (columnCount < 5) {
    throw new Error(`Invalid data structure for Stochastic Oscillator. Expected at least 5 columns (Date, Open, High, Low, Close), but got ${columnCount}.`);
  }
  // --- END of validation ---

  const dates = processedData.slice(1).map(row => row[0]);
  const highs = processedData.slice(1).map(row => row[2]);
  const lows = processedData.slice(1).map(row => row[3]);
  const closes = processedData.slice(1).map(row => row[4]);

  if (period > closes.length) {
    throw new Error(`Invalid period. The period (${period}) cannot be greater than the number of data points (${closes.length}).`);
  }

  const kValues = [];
  for (let i = period - 1; i < closes.length; i++) {
    const periodHigh = Math.max(...highs.slice(i - period + 1, i + 1));
    const periodLow = Math.min(...lows.slice(i - period + 1, i + 1));
    const currentClose = closes[i];

    // Avoid division by zero if periodHigh === periodLow
    let kValue;
    if (periodHigh === periodLow) {
        kValue = 0; // Or handle as an error/NaN depending on desired behavior
    } else {
        kValue = ((currentClose - periodLow) / (periodHigh - periodLow)) * 100;
    }
    kValues.push([dates[i], kValue]);
  }

  // Calculate %D (3-period SMA of %K)
  // SMA expects data in [date, value] format, which kValues already is.
  const dValues = SMA(kValues, 3).slice(1); // Remove headers

  // Align %K and %D lengths
  const [alignedK, alignedD] = alignLENGTHS(kValues, dValues);

  // Combine %K and %D values into final output
  const stochValues = alignedK.map((k, i) => {
    return [k[0], k[1], alignedD[i] ? alignedD[i][1] : null];
  });

  return [["Date", "%K", "%D"], ...stochValues];
}