How to Use
Follow these steps to get the Technical Analysis Functions add-on running in your spreadsheet environment.
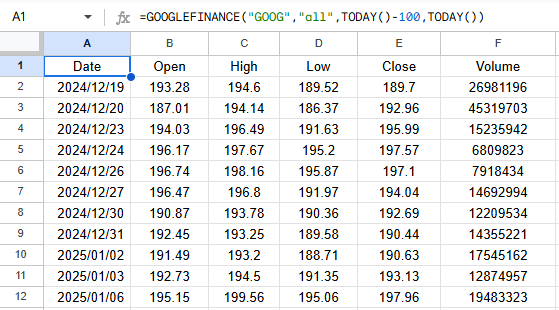
Prepare Your Data
Data can be pulled directly with the GOOGLEFINANCE() function or from any other source with standard DOHLCV : [ Date, Open, High, Low, Close, Volume ] formatting.
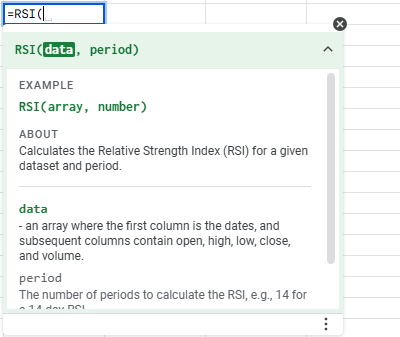
Call the Function
Use the desired indicator formula, like `=RSI(C2:C100,14)` or `=RSI(GOOGLEFINANCE(), 14)`, referencing your data range.
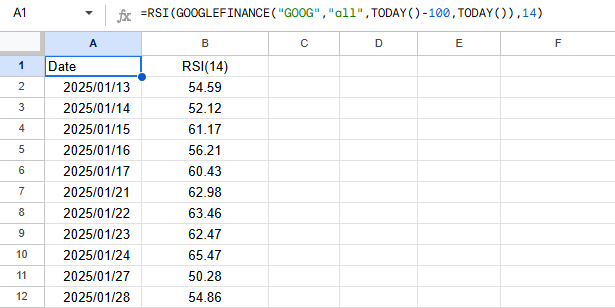
View the Output
The indicator values will populate your sheet automatically, formatted in an array style.
Tips & Best Practices
- Array Formulas: Remember that these functions return an array of values. Ensure you have enough empty space below and to the right of your formula to prevent overflow errors.
- Reference Data: Always ensure your input data is clean and contains no missing rows, as technical indicators like moving averages require a contiguous series for accurate calculation.
- Refreshing Data: Formulas will recalculate whenever you refresh your spreadsheet or update the referenced data range.