Stochastic RSI (STOCH-RSI)
The Stochastic RSI (StochRSI) is a technical indicator that measures the momentum of the Relative Strength Index (RSI), rather than price itself. It is created by applying the Stochastic Oscillator formula to a set of RSI values. The result is a more sensitive oscillator that fluctuates between 0 and 100, designed to identify short-term overbought and oversold conditions with greater frequency than the standard RSI. This increased sensitivity allows traders to pinpoint potential entry and exit points within a broader trend identified by the RSI.
STOCH_RSI
=STOCH_RSI(data, period, smoothing) Example Usage
=STOCH_RSI(A2:F500, 14, 3)
Parameters
| Parameter | Type | Description | Status |
|---|---|---|---|
data | Range | Range of columns containing the date, Open, high, Low, close, volume data. | Required |
period | Number | The number of periods (days) used to calculate the RSI. | Required |
smoothing | Number | The number of periods used to smooth the %K values into the %D signal line. | Required |
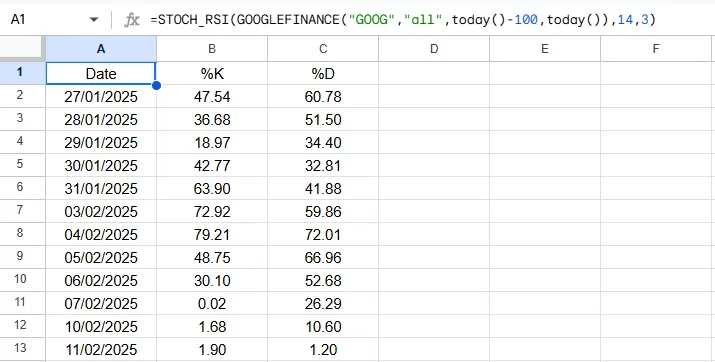
Returns
A three-column array of dates and their corresponding %K and %D values.
Source Code
Copy the following code into your Apps Script editor (Extensions > Apps Script) to use the STOCH-RSI function in your spreadsheet.
/**
 * Calculates the Stochastic RSI for a given dataset and period.
 *
 * @param {array} data - An array of historical stock data. Expected to have at least 5 columns (Date, Open, High, Low, Close) for RSI calculation.
 * @param {number} period - The number of periods for calculating the Stochastic RSI.
 * @param {number} smoothing - The number of periods for the SMA smoothing of %K and %D.
 * @returns {array} - A 2D array with headers: Date, %K, %D.
 * @customfunction
 */
function STOCH_RSI(data, period, smoothing) {
  // Argument validation
  if (arguments.length !== 3) {
    throw new Error(`Wrong number of arguments. Expected 3, but got ${arguments.length}.`);
  }
  if (typeof period !== 'number' || period <= 0 || !Number.isInteger(period)) {
    throw new Error(`Invalid period. The period must be a positive integer. Got: ${period}`);
  }
  if (typeof smoothing !== 'number' || smoothing <= 0 || !Number.isInteger(smoothing)) {
    throw new Error(`Invalid smoothing period. The smoothing period must be a positive integer. Got: ${smoothing}`);
  }

  // RSI handles its own data validation
  const rsiValues = RSI(data, period).slice(1); // Remove headers

  // Extract RSI values for %K calculation
  const dates = rsiValues.map(row => row[0]);
  const rsiOnly = rsiValues.map(row => row[1]);

  if (period >= rsiOnly.length) {
    throw new Error(`Invalid period. The period (${period}) cannot be greater than or equal to the number of RSI data points (${rsiOnly.length}).`);
  }

  // Calculate %K for each period using RSI values
  const stochRSIValues = [];
  for (let i = period - 1; i < rsiOnly.length; i++) {
    const periodHigh = Math.max(...rsiOnly.slice(i - period + 1, i + 1));
    const periodLow = Math.min(...rsiOnly.slice(i - period + 1, i + 1));
    const currentRSI = rsiOnly[i];

    let rsiValue;
    if (periodHigh === periodLow) {
        rsiValue = 0; // Avoid division by zero
    } else {
        rsiValue = ((currentRSI - periodLow) / (periodHigh - periodLow)) * 100;
    }
    stochRSIValues.push([dates[i], rsiValue]);
  }

  // Calculate %D (smoothing-period SMA of %K)
  // SMA expects data in [date, value] format, which stochRSIValues already is.
  const kValues = SMA(stochRSIValues, smoothing).slice(1); // Remove headers

  // Calculate %D (smoothing-period SMA of %K)
  const dValues = SMA(kValues, smoothing).slice(1);

  // Align %K and %D lengths
  const [alignedK, alignedD] = alignLENGTHS(kValues, dValues);

  // Combine %K and %D values into final output
  const stochRSI = alignedK.map((k, i) => {
    return [k[0], k[1], alignedD[i] ? alignedD[i][1] : null];
  });

  return [["Date", "%K", "%D"], ...stochRSI];
}