Simple Moving Average (SMA)
The Simple Moving Average (SMA) is a fundamental technical analysis tool that calculates the average price of a security over a specified number of periods. Its primary purpose is to smooth out price data by filtering short-term volatility, making it easier for traders to identify the direction of the underlying market trend.
SMA
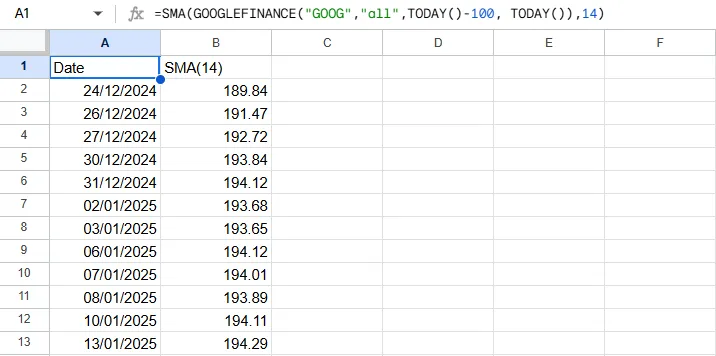
=SMA(data, period) Example Usage
=SMA(A2:F500, 50)
Parameters
| Parameter | Type | Description | Status |
|---|---|---|---|
data | Range | The input range of columns containing the Date, Open, High, Low, Close, and Volume data. | Required |
period | Number | The number of periods (days) over which the Simple Moving Average is calculated. | Required |
Returns
A two-column array of dates and their corresponding SMA values.
Source Code
Copy the following code into your Apps Script editor (Extensions > Apps Script) to use the SMA function in your spreadsheet.
sma.js
/**
 * Calculates the Simple Moving Average (SMA) for a given dataset and period.
 *
 * @param {array} data - An array of historical stock data. Can be a single column of prices or a multi-column array from GOOGLEFINANCE.
 * @param {number} period The number of periods to calculate the SMA, e.g., 14 for a 14-day SMA.
 * @returns {Array<Array>} A 2D array with headers: Date and SMA.
 * @customfunction
 */
function SMA(data, period) {
  // Argument validation
  if (arguments.length !== 2) {
    throw new Error(`Wrong number of arguments. Expected 2, but got ${arguments.length}.`);
  }
  if (typeof period !== 'number' || period <= 0 || !Number.isInteger(period)) {
    throw new Error(`Invalid period. The period must be a positive integer. Got: ${period}`);
  }

  const processedData = getData(data);

  // --- NEW: Function-level validation ---
  const columnCount = processedData[0].length;
  if (columnCount > 2 && columnCount < 5) {
      throw new Error(`Invalid data structure for SMA. For multi-column data, expected at least 5 columns (Date, O, H, L, C), but got ${columnCount}. For simple data, expected 2 columns (Date, Value).`);
  }
  // --- END of validation ---

  const dates = processedData.slice(1).map(row => row[0]);
  const values = getValues(processedData);

  if (period > values.length) {
    throw new Error(`Invalid period. The period (${period}) cannot be greater than the number of data points (${values.length}).`);
  }

  const results = [["Date", `SMA(${period})`]];

  for (let i = period - 1; i < values.length; i++) {
    const periodValues = values.slice(i - period + 1, i + 1);
    const sma = periodValues.reduce((acc, val) => acc + val, 0) / period;
    results.push([dates[i], sma]);
  }

  return results;
}