Standard Deviation (STDEV)
Standard Deviation is a statistical measure used in technical analysis to quantify market volatility. It works by calculating the dispersion of a security’s closing prices from its Simple Moving Average (SMA). A higher standard deviation value indicates that prices are more spread out, signifying greater volatility and market uncertainty. Conversely, a lower value signifies that prices are tightly clustered around the average, indicating lower volatility. It serves as the fundamental building block for other key indicators, most notably Bollinger Bands, which are plotted at standard deviation levels above and below a moving average.
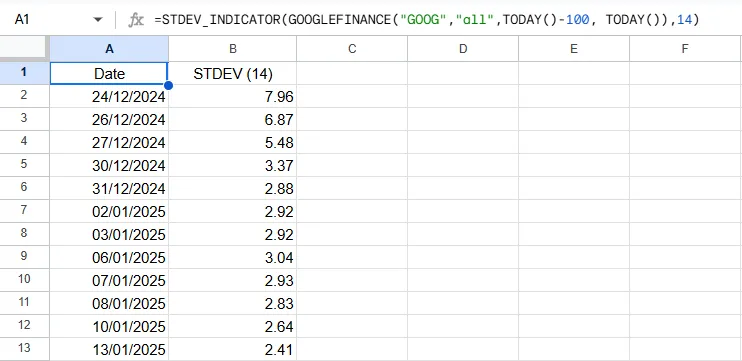
STDEV_INDICATOR
=STDEV_INDICATOR(data, period) Example Usage
=STDEV_INDICATOR(A2:F500, 20)
Parameters
| Parameter | Type | Description | Status |
|---|---|---|---|
data | Range | Range of columns containing the date, Open, high, Low, close, volume data. | Required |
period | Number | Number of (periods) days over which to calculate the Standard Deviation. | Required |
Returns
A two-column array of dates and their corresponding Standard Deviation values.
Source Code
Copy the following code into your Apps Script editor (Extensions > Apps Script) to use the STDEV function in your spreadsheet.
/**
 * Calculates the Moving Standard Deviation (Volatility) for a given dataset.
 *
 * @param {array} data - The input range. Can be a multi-column range (Date, Open, High, Low, Close, Volume) or a two-column range (Date, Value).
 * @param {number} period - The number of periods for calculating the Standard Deviation (e.g., 20).
 * @returns {array} A two-column array with headers "Date" and "STDEV".
 * @customfunction
 */
function STDEV_INDICATOR(data, period) {
  // Argument validation
  if (arguments.length !== 2) {
    throw new Error(`Wrong number of arguments. Expected 2, but got ${arguments.length}.`);
  }
  if (typeof period !== 'number' || period <= 0 || !Number.isInteger(period)) {
    throw new Error(`Invalid period. The period must be a positive integer. Got: ${period}`);
  }

  const processedData = getData(data);

  // --- NEW: Function-level validation ---
  const columnCount = processedData[0].length;
  if (columnCount > 2 && columnCount < 5) {
    throw new Error(`Invalid data structure for STDEV. For multi-column data, expected at least 5 columns (Date, O, H, L, C), but got ${columnCount}. For simple data, expected 2 columns (Date, Value).`);
  }
  // --- END of validation ---

  const dates = processedData.slice(1).map(row => row[0]);
  const values = getValues(processedData);

  if (period > values.length) {
    throw new Error(`Invalid period. The period (${period}) cannot be greater than the number of data points (${values.length}).`);
  }

  const results = [["Date", `STDEV(${period})`]];

  for (let i = period - 1; i < values.length; i++) {
    const periodValues = values.slice(i - period + 1, i + 1);

    // Calculate the mean of the current period
    const mean = periodValues.reduce((acc, val) => acc + val, 0) / period;

    // Calculate the variance
    const squaredDifferences = periodValues.map(val => Math.pow(val - mean, 2));
    const variance = squaredDifferences.reduce((acc, val) => acc + val, 0) / period;

    // Calculate the standard deviation
    const standardDeviation = Math.sqrt(variance);

    results.push([dates[i], standardDeviation]);
  }

  return results;
}