Moving Average Convergence Divergence (MACD)
The Moving Average Convergence Divergence (MACD), developed by Gerald Appel, is a widely used trend-following momentum indicator that shows the relationship between two Exponential Moving Averages (EMAs) of a security’s price. The MACD is composed of three main elements: the MACD line itself (the difference between two EMAs), a ‘signal line’ (an EMA of the MACD line), and a histogram (the difference between the MACD and signal lines). Traders use the MACD to identify changes in the direction, strength, and momentum of a price trend, often looking for crossovers between the MACD line and the signal line as potential buy or sell signals.
MACD
=MACD(data, shortPeriod, longPeriod, signalPeriod) Example Usage
=MACD(A2:F500, 12, 26, 9)
Parameters
| Parameter | Type | Description | Status |
|---|---|---|---|
data | Range | The input range of columns containing the Date, Open, High, Low, Close, and Volume data. | Required |
shortPeriod | Number | Number of periods (days) used for calculating the short-term Exponential Moving Average (EMA). Typically 12 periods. | Required |
longPeriod | Number | Number of periods (days) used for calculating the long-term EMA. Typically 26 periods. | Required |
signalPeriod | Number | Number of periods (days) used for calculating the EMA of the MACD line itself, known as the signal line. Typically 9 periods. | Required |
Returns
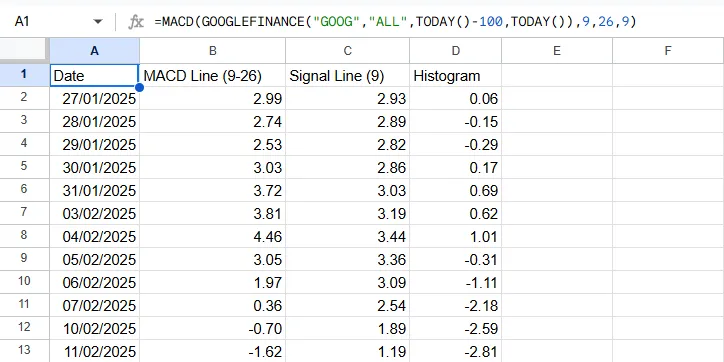
A four-column array of dates with corresponding MACD line, signal line, and histogram values.
Source Code
Copy the following code into your Apps Script editor (Extensions > Apps Script) to use the MACD function in your spreadsheet.
/**
 * Calculates the Moving Average Convergence Divergence (MACD) for a given dataset and periods.
 *
 * @param {array} data - An array of historical stock data. Expected to have at least 5 columns (Date, O, H, L, C) for EMA calculation.
 * @param {number} shortPeriod The number of periods for the short EMA, e.g., 12 for a 12-day EMA.
 * @param {number} longPeriod The number of periods for the long EMA. e.g., 26 for a 26-day EMA.
 * @param {number} signalPeriod The number of periods for the signal line EMA. e.g., 9 for a 9-day EMA.
 * @returns {Array} A 2D array with headers: Date, MACD Line, Signal Line, Histogram.
 * @customfunction
 */
function MACD(data, shortPeriod, longPeriod, signalPeriod) {
  // Argument validation
  if (arguments.length !== 4) {
    throw new Error(`Wrong number of arguments. Expected 4, but got ${arguments.length}.`);
  }
  if (typeof shortPeriod !== 'number' || shortPeriod <= 0 || !Number.isInteger(shortPeriod)) {
    throw new Error(`Invalid shortPeriod. Must be a positive integer. Got: ${shortPeriod}`);
  }
  if (typeof longPeriod !== 'number' || longPeriod <= 0 || !Number.isInteger(longPeriod)) {
    throw new Error(`Invalid longPeriod. Must be a positive integer. Got: ${longPeriod}`);
  }
  if (typeof signalPeriod !== 'number' || signalPeriod <= 0 || !Number.isInteger(signalPeriod)) {
    throw new Error(`Invalid signalPeriod. Must be a positive integer. Got: ${signalPeriod}`);
  }
  if (shortPeriod >= longPeriod) {
    throw new Error(`Invalid periods. shortPeriod (${shortPeriod}) must be less than longPeriod (${longPeriod}).`);
  }

  const processedData = getData(data);
  // Data validation for processedData is handled by EMA function calls.

  // Calculate short and long EMAs from the processed data
  const shortEMA = EMA(data, shortPeriod).slice(1); // Remove headers
  const longEMA = EMA(data, longPeriod).slice(1); // Remove headers

  // Align the lengths of short and long EMAs
  const [alignedShortEMA, alignedLongEMA] = alignLENGTHS(shortEMA, longEMA);

  // Calculate the MACD line
  const macdLine = alignedShortEMA.map((row, i) => {
    const date = row[0];
    const value = row[1] - alignedLongEMA[i][1];
    return [date, value];
  });

  // Calculate the signal line from the MACD line
  const signalLine = EMA(macdLine.map(item => [item[0], item[1]]), signalPeriod).slice(1); // Remove headers

  // Align the lengths of the MACD line and signal line
  const [alignedMacdLine, alignedSignalLine] = alignLENGTHS(macdLine, signalLine);

  // Calculate the histogram
  const histogram = alignedMacdLine.map((item, i) => {
    return [item[0], item[1], alignedSignalLine[i][1], item[1] - alignedSignalLine[i][1]];
  });

  // Prepare the final MACD data structure
  return [["Date", `MACD Line (${shortPeriod}-${longPeriod})`, `Signal Line (${signalPeriod})`, "Histogram"], ...histogram];
}