Williams %R (WPR)
Williams %R (WPR) is a momentum oscillator that measures overbought and oversold levels. It moves between 0 and -100 and helps identify potential reversals.
Key Levels
- 0 to -20: Overbought (Potential for price drop)
- -80 to -100: Oversold (Potential for price rise)
WPR
=WPR(data, period) Example Usage
=WPR(A2:F500, 14)
Parameters
| Parameter | Type | Description | Status |
|---|---|---|---|
data | Range | The input range of columns containing the Date, Open, High, Low, Close, and Volume data. | Required |
period | Number | The lookback period (e.g., 14). | Required |
Return Value
A two-column array of dates and their corresponding Williams %R values.
Source Code
Copy the following code into your Apps Script editor (Extensions > Apps Script) to use the WPR function in your spreadsheet.
wpr.js
/**
* Calculates Williams %R, a momentum indicator that measures overbought and oversold levels.
*
* @param {array} data - The input range. Must include at least 5 columns: Date, Open, High, Low, Close.
* @param {number} period - The lookback period (e.g., 14).
* @returns {array} A two-column array with headers "Date" and "Williams %R".
* @customfunction
*/
function WPR(data, period) {
checkPremium();
// Argument validation
if (arguments.length !== 2) {
throw new Error(`Wrong number of arguments. Expected 2, but got ${arguments.length}.`);
}
if (typeof period !== 'number' || period <= 0 || !Number.isInteger(period)) {
throw new Error(`Invalid period. The period must be a positive integer. Got: ${period}`);
}
const processedData = getData(data);
// --- NEW: Function-level validation ---
const columnCount = processedData[0].length;
if (columnCount < 5) {
throw new Error(`Invalid data structure for Williams %R. Expected at least 5 columns (Date, Open, High, Low, Close), but got ${columnCount}.`);
}
// --- END of validation ---
const dates = processedData.slice(1).map(row => row[0]);
const highs = processedData.slice(1).map(row => row[2]);
const lows = processedData.slice(1).map(row => row[3]);
const closes = processedData.slice(1).map(row => row[4]);
if (period > closes.length) {
throw new Error(`Invalid period. The period (${period}) cannot be greater than the number of data points (${closes.length}).`);
}
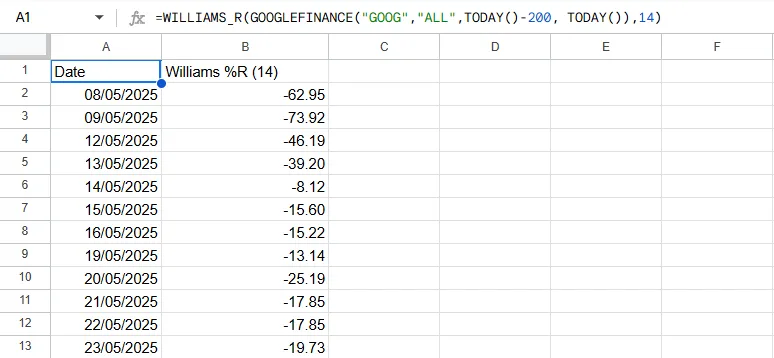
const results = [["Date", `Williams %R (${period})`]];
for (let i = period - 1; i < closes.length; i++) {
const periodHigh = Math.max(...highs.slice(i - period + 1, i + 1));
const periodLow = Math.min(...lows.slice(i - period + 1, i + 1));
const currentClose = closes[i];
let williamsR;
if (periodHigh === periodLow) {
williamsR = 0; // Avoid division by zero
} else {
williamsR = ((periodHigh - currentClose) / (periodHigh - periodLow)) * -100;
}
results.push([dates[i], williamsR]);
}
return results;
}