 DEUSHARVEST
On-Balance Volume (OBV)
On-Balance Volume (OBV) is a momentum indicator that uses volume flow to predict changes in stock price. Joseph Granville developed the OBV metric in the 1963 book Granville’s New Key to Stock Market Profits. buying pressure is evident when OBV is rising, and selling pressure is evident when OBV is falling.
OBV
=OBV(data) Example Usage
=OBV(A2:F500)
Parameters
| Parameter | Type | Description | Status |
|---|---|---|---|
data | Range | The input range of columns containing the Date, Open, High, Low, Close, and Volume data. | Required |
Returns
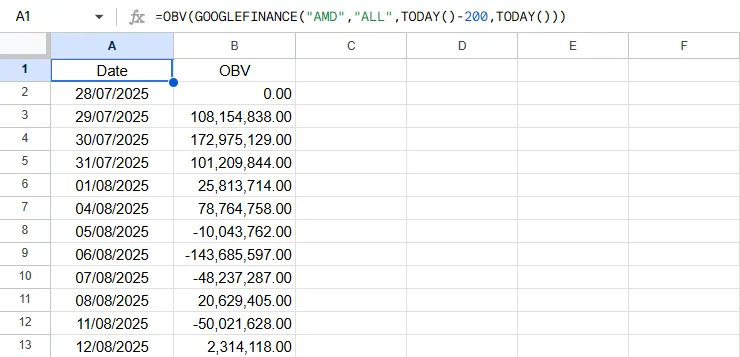
A two-column array of dates and their corresponding OBV values.
💡 Interpretation Note
Important: OBV is a cumulative indicator. Its absolute value depends entirely on the start date of your data. Do not compare the specific number (e.g., “50,000”) to other platforms. Instead, look at the slope and direction. If the OBV line is rising while price is falling (divergence), it signals potential buying pressure.
Source Code
Copy the following code into your Apps Script editor (Extensions > Apps Script) to use the OBV function in your spreadsheet.
/**
 * Calculates the On-Balance Volume (OBV) for a given dataset.
 * OBV requires data with at least 6 columns: Date, Open, High, Low, Close, and Volume.
 *
 * @param {array} data - A 2D array of historical stock data from a source like GOOGLEFINANCE.
 * @returns {array} A 2D array with headers: Date and OBV.
 * @customfunction
 */
function OBV(data) {
    checkPremium();

  // Argument validation
  if (arguments.length !== 1) {
    throw new Error(`Wrong number of arguments. Expected 1, but got ${arguments.length}.`);
  }

  const processedData = getData(data);

  // --- Function-level validation for DOHLCV data ---
  const columnCount = processedData[0].length;
  if (columnCount < 6) {
      throw new Error(`Invalid data structure for OBV. Expected at least 6 columns (Date, O, H, L, C, V), but got ${columnCount}.`);
  }
  // --- END of validation ---

  // processedData includes headers, so data rows are from index 1 onwards.
  const dataRows = processedData.slice(1);

  if (dataRows.length < 2) {
    throw new Error(`Invalid data. OBV requires at least two data points to compare closing prices.`);
  }

  const results = [["Date", "OBV"]];
  let currentOBV = 0;

  // The first OBV value is typically 0, corresponding to the first day.
  // Or, some start calculations from the second day. Let's align with the common technical analysis approach
  // where the first point establishes the baseline. Here, we'll return an OBV value for each day.

  // Set the first day's OBV to 0.
  results.push([dataRows[0][0], 0]);

  // Loop through the rest of the data
  for (let i = 1; i < dataRows.length; i++) {
    const currentDate = dataRows[i][0];
    const currentClose = dataRows[i][4];
    const currentVolume = dataRows[i][5];
    const prevClose = dataRows[i - 1][4];

    if (currentClose > prevClose) {
      currentOBV += currentVolume;
    } else if (currentClose < prevClose) {
      currentOBV -= currentVolume;
    }
    // If closes are equal, OBV does not change.

    results.push([currentDate, currentOBV]);
  }

  return results;
}