 DEUSHARVEST
Ichimoku Cloud
The Ichimoku Cloud (Ichimoku Kinko Hyo) is a versatile indicator that defines support and resistance, identifies trend direction, gauges momentum, and provides trading signals. It consists of five lines: Tenkan-sen (Conversion Line), Kijun-sen (Base Line), Senkou Span A (Leading Span A), Senkou Span B (Leading Span B), and Chikou Span (Lagging Span).
ICHIMOKU
=ICHIMOKU(data, tenkanPeriod, kijunPeriod, senkouBPeriod) Example Usage
=ICHIMOKU(A2:F500, 9, 26, 52)
Parameters
| Parameter | Type | Description | Status |
|---|---|---|---|
data | Range | The input range of columns containing the Date, Open, High, Low, Close, and Volume data. | Required |
tenkanPeriod | Number | The period for the Tenkan-sen (Conversion Line). Default is 9. | Optional |
kijunPeriod | Number | The period for the Kijun-sen (Base Line). Default is 26. | Optional |
senkouBPeriod | Number | The period for the Senkou Span B (Leading Span B). Default is 52. | Optional |
Returns
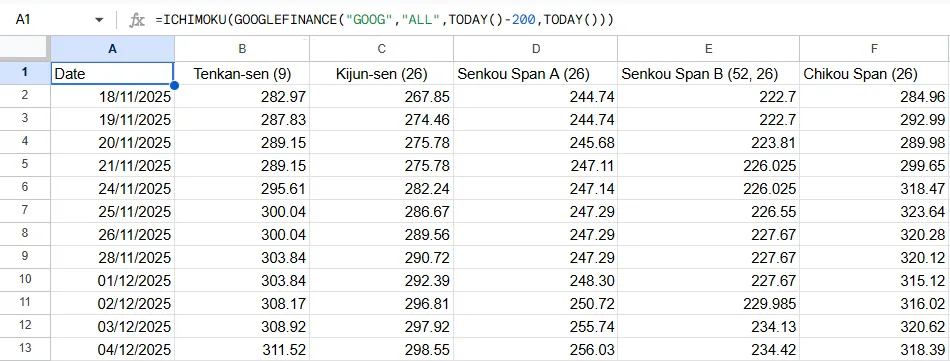
A multi-column array containing:
- Date
- Tenkan-sen: (Highest High + Lowest Low) / 2 for the past tenkanPeriod.
- Kijun-sen: (Highest High + Lowest Low) / 2 for the past kijunPeriod.
- Senkou Span A: (Tenkan-sen + Kijun-sen) / 2, plotted 26 periods ahead.
- Senkou Span B: (Highest High + Lowest Low) / 2 for the past senkouBPeriod, plotted 26 periods ahead.
- Chikou Span: Closing price plotted 26 periods behind.
Source Code
Copy the following code into your Apps Script editor (Extensions > Apps Script) to use the ICHIMOKU-CLOUD function in your spreadsheet.
ichimoku.js
/**
 * Calculates the Ichimoku Cloud.
 * A comprehensive indicator that defines support/resistance, trend, and momentum.
 *
 * @param {array} data - The input range. Must include at least 4 columns: Date, Open, High, Low.
 * @param {number} [tenkanPeriod=9] - Conversion Line period (default 9).
 * @param {number} [kijunPeriod=26] - Base Line period (default 26).
 * @param {number} [senkouBPeriod=52] - Leading Span B period (default 52).
 * @param {number} [offset=26] - Displacement (default 26).
 * @returns {array} A multi-column array with headers: Date, Tenkan-sen, Kijun-sen, Senkou Span A, Senkou Span B, Chikou Span.
 * @customfunction
 */
function ICHIMOKU(data, tenkanPeriod = 9, kijunPeriod = 26, senkouBPeriod = 52, offset = 26) {
    checkPremium();

    // Argument validation
    if (arguments.length > 5) {
        throw new Error(`Wrong number of arguments.`);
    }

    const processedData = getData(data);
    const columnCount = processedData[0].length;
    if (columnCount < 4) {
        throw new Error(`Invalid data structure. Expected at least 4 columns (Date, O, H, L).`);
    }

    const dataRows = processedData.slice(1);
    const results = [["Date", `Tenkan-sen (${tenkanPeriod})`, `Kijun-sen (${kijunPeriod})`, `Senkou Span A (${offset})`, `Senkou Span B (${senkouBPeriod}, ${offset})`, `Chikou Span (${offset})`]];

    // Buffers
    const highBuffer = [];
    const lowBuffer = [];

    // Displacement Queues
    // Senkou A/B are calculated today but plotted 'offset' periods ahead.
    // To align them to the CURRENT date (i.e. "What is the Cloud value for today?"),
    // We need the value that was calculated 'offset' periods ago.
    const spanAQueue = [];
    const spanBQueue = [];
    for (let k = 0; k < offset; k++) {
        spanAQueue.push(null);
        spanBQueue.push(null);
    }

    const maxPeriod = Math.max(tenkanPeriod, kijunPeriod, senkouBPeriod);

    for (let i = 0; i < dataRows.length; i++) {
        const row = dataRows[i];
        const date = row[0];
        const high = row[2];
        const low = row[3];
        const close = row[4];

        highBuffer.push(high);
        lowBuffer.push(low);

        if (highBuffer.length > maxPeriod) {
            highBuffer.shift();
            lowBuffer.shift();
        }

        // Helper for Max/Min
        const getMaxMin = (period) => {
            if (highBuffer.length < period) return null;
            let maxH = -Infinity;
            let minL = Infinity;
            // Scan the last 'period' entries of the buffer
            // Buffer size is at most maxPeriod.
            // We need indices [length - period] to [length - 1]
            const startIdx = highBuffer.length - period;
            for (let j = startIdx; j < highBuffer.length; j++) {
                if (highBuffer[j] > maxH) maxH = highBuffer[j];
                if (lowBuffer[j] < minL) minL = lowBuffer[j];
            }
            return (maxH + minL) / 2;
        };

        const tenkan = getMaxMin(tenkanPeriod);
        const kijun = getMaxMin(kijunPeriod);
        const senkouB_calc = getMaxMin(senkouBPeriod);

        let senkouA_calc = null;
        if (tenkan !== null && kijun !== null) {
            senkouA_calc = (tenkan + kijun) / 2;
        }

        // Queue Logic
        const currentSpanA = spanAQueue.shift();
        const currentSpanB = spanBQueue.shift();

        spanAQueue.push(senkouA_calc);
        spanBQueue.push(senkouB_calc);

        // Chikou: Strictly, Chikou at Date[i] is Close[i] plotted at i-26.
        // But in a data table, Chikou[i] usually holds Close[i].

        results.push([
            date,
            tenkan === null ? "" : tenkan,
            kijun === null ? "" : kijun,
            currentSpanA === null || currentSpanA === undefined ? "" : currentSpanA,
            currentSpanB === null || currentSpanB === undefined ? "" : currentSpanB,
            close
        ]);
    }

    // Trim Output
    // Align to the slowest component dynamically.
    // We iterate to find the first row where ALL critical indicators are valid.
    // This ensures no "ragged" starts, regardless of which period (Tenkan, Kijun, or Span B) is longest.
    let firstValidIndex = -1;
    for (let i = 1; i < results.length; i++) {
        const row = results[i];
        // Check Tenkan[1], Kijun[2], SpanA[3], SpanB[4]
        if (row[1] !== "" && row[1] !== null &&
            row[2] !== "" && row[2] !== null &&
            row[3] !== "" && row[3] !== null &&
            row[4] !== "" && row[4] !== null) {
            firstValidIndex = i;
            break;
        }
    }

    if (firstValidIndex !== -1) {
        return [results[0], ...results.slice(firstValidIndex)];
    } else {
        return [results[0]];
    }
}