 DEUSHARVEST
Elder Ray Index (ERI)
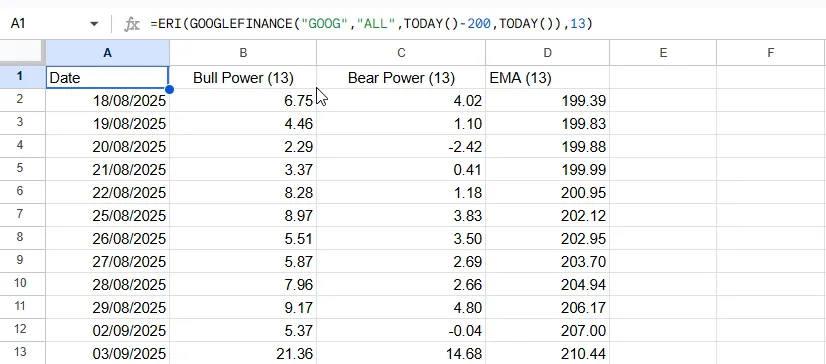
The Elder Ray Index (ERI), developed by Dr. Alexander Elder, measures the amount of buying and selling pressure in the market. It consists of three components: an Exponential Moving Average (EMA) representing the consensus of value, “Bull Power” representing the ability of buyers to drive prices above the consensus, and “Bear Power” representing the ability of sellers to drive prices below the consensus.
ERI
=ERI(data, period) Example Usage
=ERI(A2:F500, 13)
Parameters
| Parameter | Type | Description | Status |
|---|---|---|---|
data | Range | The input range of columns containing the Date, Open, High, Low, Close, and Volume data. | Required |
period | Number | The EMA period used as the baseline. Default is 13. | Optional |
Returns
A multi-column array containing:
- Date
- Bull Power: High - EMA.
- Bear Power: Low - EMA.
- EMA: The exponential moving average baseline.
Source Code
Copy the following code into your Apps Script editor (Extensions > Apps Script) to use the ELDER-RAY function in your spreadsheet.
elderRay.js
/**
 * Calculates the Elder-Ray Index.
 * Measures buying and selling pressure.
 * Components:
 * 1. EMA(Close, period)
 * 2. Bull Power = High - EMA
 * 3. Bear Power = Low - EMA
 *
 * @param {array} data - The input range. Must include at least 5 columns: Date, Open, High, Low, Close.
 * @param {number} [period=13] - The EMA period (default 13).
 * @returns {array} A multi-column array with headers "Date", "Bull Power", "Bear Power", "EMA".
 * @customfunction
 */
function ERI(data, period = 13) {
    checkPremium();

    // Argument validation
    if (arguments.length < 1 || arguments.length > 2) {
        throw new Error(`Wrong number of arguments. Expected 1 or 2, but got ${arguments.length}.`);
    }
    if (period !== undefined) {
        if (typeof period !== 'number' || period <= 0 || !Number.isInteger(period)) {
            throw new Error(`Invalid period. The period must be a positive integer. Got: ${period}`);
        }
    }

    const processedData = getData(data);

    // --- Validate Data Structure ---
    const columnCount = processedData[0].length;
    if (columnCount < 5) {
        throw new Error(`Invalid data structure. Expected at least 5 columns (Date, O, H, L, C), but got ${columnCount}.`);
    }

    const dataRows = processedData.slice(1);
    const results = [["Date", `Bull Power (${period})`, `Bear Power (${period})`, `EMA (${period})`]];

    // Logic: Calculate EMA, then subtract from High/Low.
    // We use self-contained EMA calculation loop.

    let ema = 0;
    const k = 2 / (period + 1);
    const buffer = []; // buffer for initial SMA
    let sum = 0;

    for (let i = 0; i < dataRows.length; i++) {
        const row = dataRows[i];
        const date = row[0];
        const high = row[2];
        const low = row[3];
        const close = row[4];

        let bullPower = "";
        let bearPower = "";
        let currentEma = "";

        // EMA State Machine
        if (buffer.length < period) {
            buffer.push(close);
            sum += close;

            if (buffer.length === period) {
                // Initialize EMA with SMA
                ema = sum / period;
                currentEma = ema;
                bullPower = high - ema;
                bearPower = low - ema;
            }
        } else {
            // Calculate EMA
            ema = (close * k) + (ema * (1 - k));
            currentEma = ema;
            bullPower = high - ema;
            bearPower = low - ema;
        }

        if (currentEma === "") {
            results.push([date, "", "", ""]);
        } else {
            results.push([date, bullPower, bearPower, currentEma]);
        }
    }

    // Trim Output
    let firstValidIndex = -1;
    for (let i = 1; i < results.length; i++) {
        if (results[i][1] !== "" && results[i][1] !== null) {
            firstValidIndex = i;
            break;
        }
    }

    if (firstValidIndex !== -1) {
        return [results[0], ...results.slice(firstValidIndex)];
    } else {
        return [results[0]];
    }
}