 DEUSHARVEST
Donchian Channels
Donchian Channels are a volatility indicator that identifies the high and low price ranges over a specific period of time. They consist of three lines: the Upper Channel (highest high), the Lower Channel (lowest low), and the Basis (average of the upper and lower channels). They are widely used to identify breakouts and trend reversals.
DONCHIAN
=DONCHIAN(data, period) Example Usage
=DONCHIAN(A2:F500, 20)
Parameters
| Parameter | Type | Description | Status |
|---|---|---|---|
data | Range | The input range of columns containing the Date, Open, High, Low, Close, and Volume data. | Required |
period | Number | The lookback period for finding the highest high and lowest low. Default is 20. | Optional |
Returns
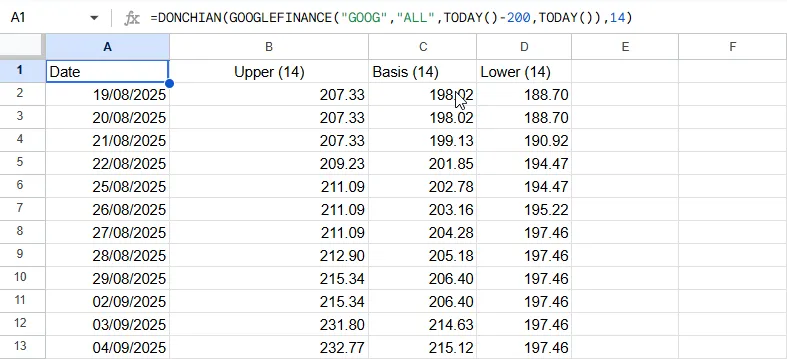
A multi-column array containing:
- Date
- Upper: The highest price over the last n periods.
- Basis: The average of the Upper and Lower bands.
- Lower: The lowest price over the last n periods.
Source Code
Copy the following code into your Apps Script editor (Extensions > Apps Script) to use the DONCHIAN-CHANNELS function in your spreadsheet.
donchian.js
/**
 * Calculates Donchian Channels.
 * Upper Channel = Highest High in period.
 * Lower Channel = Lowest Low in period.
 * Basis = Average of Upper and Lower.
 *
 * @param {array} data - The input range. Must include at least 4 columns: Date, Open, High, Low.
 * @param {number} [period=20] - The lookback period (default 20).
 * @returns {array} A multi-column array with headers "Date", "Upper", "Channel Basis", "Lower".
 * @customfunction
 */
function DONCHIAN(data, period = 20) {
    checkPremium();

    // Argument validation
    if (arguments.length < 1 || arguments.length > 2) {
        throw new Error(`Wrong number of arguments. Expected 1 or 2, but got ${arguments.length}.`);
    }
    if (period !== undefined) {
        if (typeof period !== 'number' || period <= 0 || !Number.isInteger(period)) {
            throw new Error(`Invalid period. The period must be a positive integer. Got: ${period}`);
        }
    }

    const processedData = getData(data);

    // --- Validate Data Structure ---
    const columnCount = processedData[0].length;
    if (columnCount < 4) {
        throw new Error(`Invalid data structure. Expected at least 4 columns (Date, O, H, L), but got ${columnCount}.`);
    }

    const dataRows = processedData.slice(1);
    const results = [["Date", `Upper (${period})`, `Basis (${period})`, `Lower (${period})`]];

    // Logic: Sliding Window Max/Min
    // Efficient Approach: Store the last 'period' highs and lows in a buffer.
    // For strict performance on large arrays, a deque is best, but JS Array is fine for period ~20.

    // Note on Definition:
    // Standard Donchian uses the High/Low of the LAST n periods *including* current?
    // Or *excluding* current (lagged)?
    // TradingView "Donchian Channels" includes the current bar in the calculation.

    const highBuffer = [];
    const lowBuffer = [];

    for (let i = 0; i < dataRows.length; i++) {
        const row = dataRows[i];
        const date = row[0];
        const high = row[2];
        const low = row[3];

        highBuffer.push(high);
        lowBuffer.push(low);

        if (highBuffer.length > period) {
            highBuffer.shift();
            lowBuffer.shift();
        }

        if (highBuffer.length < period) {
            results.push([date, "", "", ""]);
            continue;
        }

        const upper = Math.max(...highBuffer);
        const lower = Math.min(...lowBuffer);
        const basis = (upper + lower) / 2;

        results.push([date, upper, basis, lower]);
    }

    // Trim Output: Find first index where Upper is not empty
    let firstValidIndex = -1;
    // Iterate from 1 (skip header)
    for (let i = 1; i < results.length; i++) {
        if (results[i][1] !== "" && results[i][1] !== null) {
            firstValidIndex = i;
            break;
        }
    }

    if (firstValidIndex !== -1) {
        // Return Header + Slice from First Valid
        return [results[0], ...results.slice(firstValidIndex)];
    } else {
        return [results[0]];
    }
}