 DEUSHARVEST
Accumulation/Distribution Line (ADL)
The Accumulation/Distribution Line (ADL) is a volume-based indicator designed to measure the cumulative flow of money into and out of a security. It combines price and volume to show how strong a trend is. If the price is rising but the ADL is falling, it suggests that buying pressure is weak and the trend may reverse.
ADL
=ADL(data) Example Usage
=ADL(A2:F500)
Parameters
| Parameter | Type | Description | Status |
|---|---|---|---|
data | Range | The input range of columns containing the Date, Open, High, Low, Close, and Volume data. | Required |
Returns
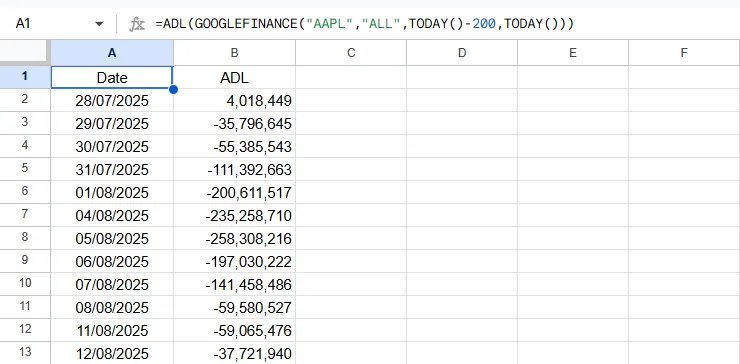
A two-column array of dates and their corresponding ADL values.
💡 Interpretation Note
Important: The ADL is a cumulative indicator. Its absolute value depends entirely on the start date of your data. Do not compare the specific number (e.g., “50,000”) to other platforms. Instead, look at the slope and direction. If the ADL line is rising while price is falling (divergence), it signals potential buying pressure.
Source Code
Copy the following code into your Apps Script editor (Extensions > Apps Script) to use the ADL function in your spreadsheet.
/**
 * Calculates the Accumulation/Distribution Line (ADL).
 * The ADL is a cumulative indicator that uses volume and price to assess buying and selling pressure.
 * Requires data with at least 6 columns: Date, Open, High, Low, Close, and Volume.
 *
 * @param {array} data - A 2D array of historical stock data (DOHLCV) from a source like GOOGLEFINANCE.
 * @returns {array} A 2D array with headers: Date and ADL.
 * @customfunction
 */
function ADL(data) {
    checkPremium();

  // Argument validation
  if (arguments.length !== 1) {
    throw new Error(`Wrong number of arguments. Expected 1, but got ${arguments.length}.`);
  }

  const processedData = getData(data);

  // --- Function-level validation for DOHLCV data ---
  const columnCount = processedData[0].length;
  if (columnCount < 6) {
      throw new Error(`Invalid data structure for ADL. Expected at least 6 columns (Date, O, H, L, C, V), but got ${columnCount}.`);
  }
  // --- END of validation ---

  const dataRows = processedData.slice(1);
  const results = [["Date", "ADL"]];
  let adl = 0;

  for (let i = 0; i < dataRows.length; i++) {
    const row = dataRows[i];
    const date = row[0];
    const high = row[2];
    const low = row[3];
    const close = row[4];
    const volume = row[5];

    let moneyFlowMultiplier = 0;
    // Avoid division by zero if high and low are the same
    if (high !== low) {
      moneyFlowMultiplier = ((close - low) - (high - close)) / (high - low);
    }

    const moneyFlowVolume = moneyFlowMultiplier * volume;
    adl += moneyFlowVolume;

    results.push([date, adl]);
  }

  return results;
}