Volatility Spike Indicators: A Better Way to Spot Major Price Moves
Major Movers

Many financial news dashboards and popular stock screeners highlight “major movers” based on daily price returns.
While this seems straightforward, suggesting a significant gain or loss, the reality is more nuanced. A single day’s move tells you what happened, but not how important it is. Without context, you cannot tell if the change is truly meaningful or just part of the stock’s normal price behavior.
For example, consider two stocks, A and B, with the following daily returns over five days:
| Day | 1 | 2 | 3 | 4 | 5 |
|---|---|---|---|---|---|
| Stock A | -2.81% | -2.61% | 3.00% | 1.96% | -2.31% |
| Stock B | 0.56% | -0.77% | -0.44% | 0.61% | -2.31% |
Looking only at Day 5, both stocks have a return of -2.31%, suggesting equal significance. But when we view their recent price history, Stock B’s return stands out as more significant relative to its volatility, whereas Stock A’s move is more typical given its recent swings.
This example highlights a key flaw in using raw daily returns: they lack context.
To truly understand if a move is meaningful, we need metrics that account for a stock’s usual behavior, how volatile it tends to be, and how today’s movement compares to that norm. That’s where Volatility Spike Indicators come in.
In this article, we’ll explore what they are, how they work, how to calculate them, and why they’re a better lens for identifying meaningful market moves than raw returns alone.
What Are Volatility Spike Indicators?
Volatility Spike Indicators (VSIs) are designed to detect unusual or outsized price movements by comparing today’s action to a stock’s recent volatility.
They don’t just look at how much a price changed; they measure how that change compares to what’s typical for the stock.
In simple terms, a VSI answers the question:
Is this move normal for this stock, or is it a spike worth investigating?
By taking volatility into account, VSIs help distinguish between routine noise and meaningful shifts by filtering out normal price behavior and spotlighting the real outliers.
There are several ways to construct a Volatility Spike Indicator, depending on whether you measure price changes by returns (closing price movements) or by ranges (intraday movement). In this discussion, we focus on two approaches that will serve as foundational methods in our work: the SigmaSpike, which flags unusual price returns using the standard deviation of recent returns, and the RangeSpike, which highlights price range expansions using the Average True Range (ATR).
The SigmaSpike
The SigmaSpike, developed by trader and author Adam Grimes, evaluates the significance of a day’s price return by measuring it against the standard deviation of the last 20 daily returns.
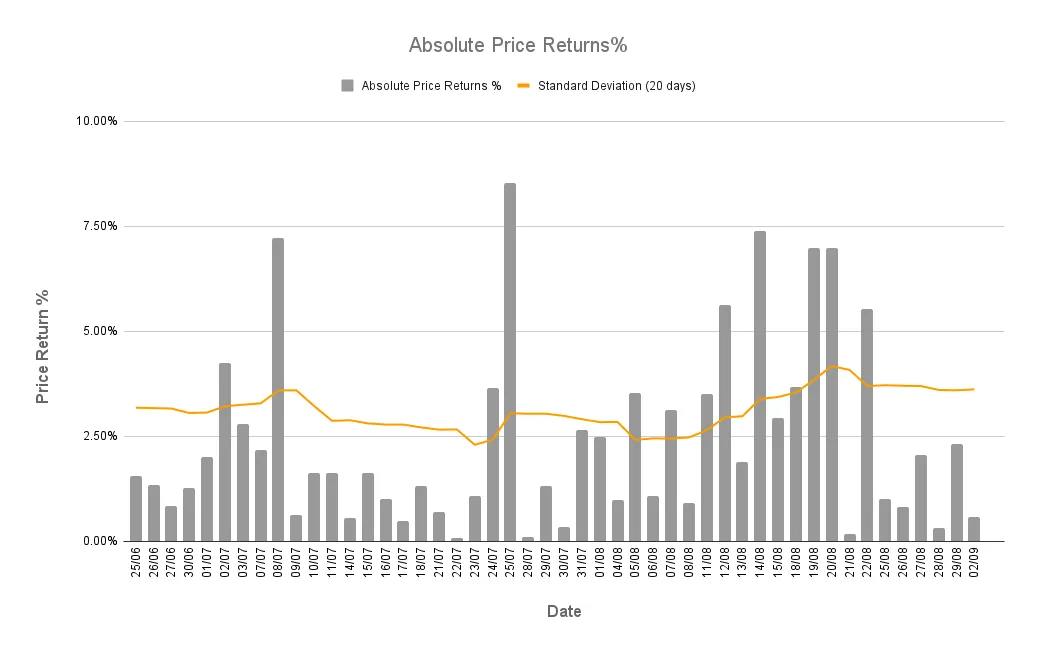
Calculation
The SigmaSpike is calculated by dividing today’s absolute price return by the 20-day standard deviation of returns.
Formula: SigmaSpike = ABS(Today's Return) / Stdev(Returns, 20)
For example, if a stock has:
- A 20-day standard deviation of returns of 1.53%
- A current day’s return of 4.02%
The calculation would be: SigmaSpike = 4.02% / 1.53% = 2.63
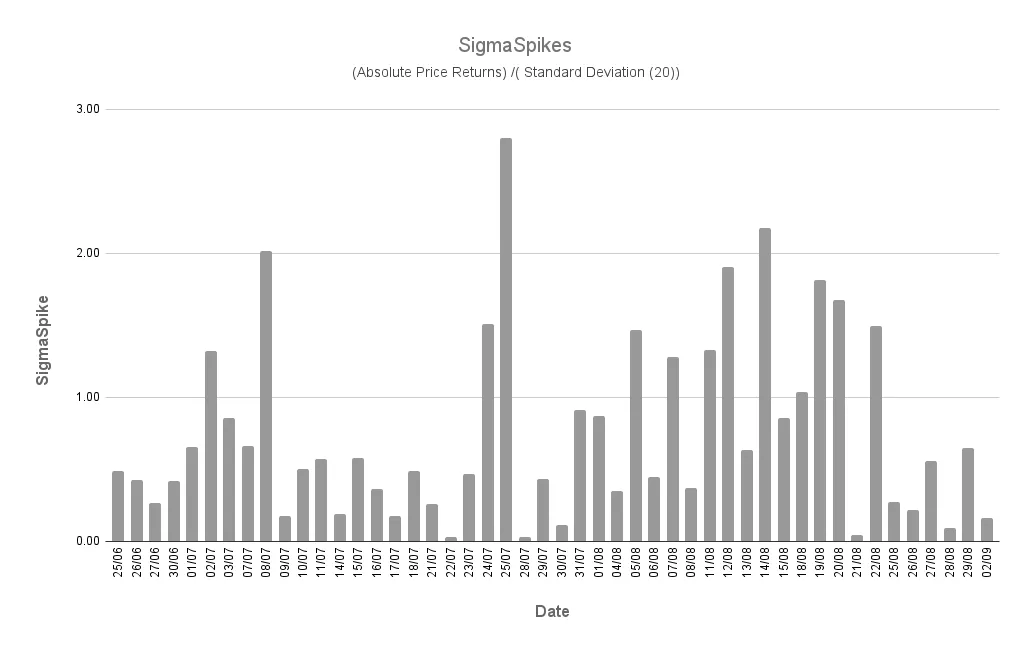
Interpretation
The standard rule of thumb is to treat a SigmaSpike of 2.0 or higher as a statistically significant event. However, the market’s personality is not static. What constitutes a “statistically significant” event can shift with overall market conditions. To gain an edge, we must look directly at the recent distribution of spikes and understand the two extremes of the volatility spectrum:
-
High Spikes: A spike of 2.0 or greater is a powerful signal of a potential market transition. This is the signature of an exhaustion event at the end of a trend or the forceful initiation of a new one.
-
Low Spikes: A ratio close to zero is just as significant. This represents an abnormal compression of volatility. This is the market coiling and building potential energy for its next explosive move.
The RangeSpike
The RangeSpike is designed to gauge intraday volatility by comparing the True Range of the current day to the Average True Range over the past 10 to 14 days.
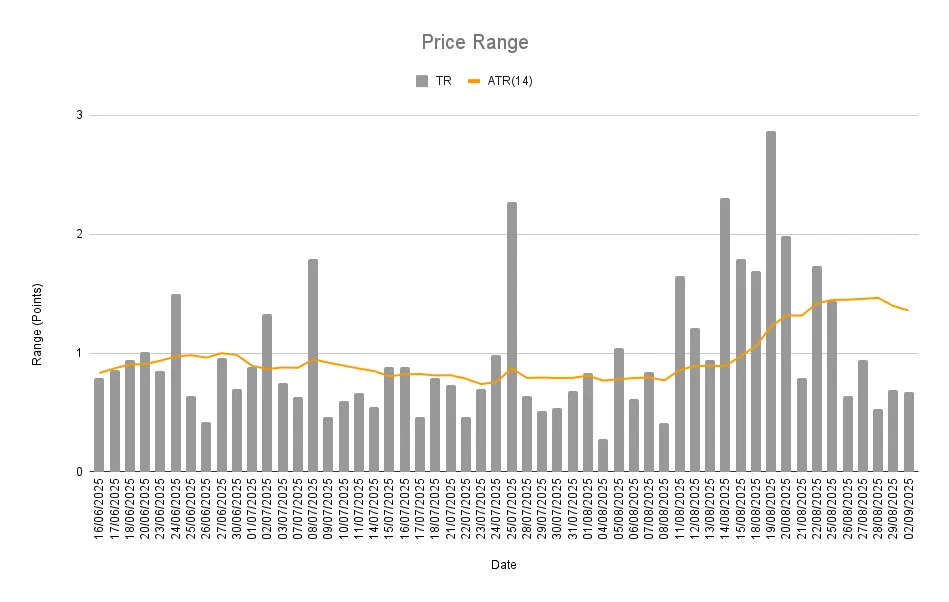
Calculation
The RangeSpike is calculated by dividing today’s True Range by a 10- to 14-day Average True Range.
Formula: RangeSpike = True Range / ATR(14)
For example, if a stock has:
- A True Range of $5.00
- And an ATR(14) of $7.00
The RangeSpike would be calculated as follows:
RangeSpike = $5.00 / $7.00 = 0.71
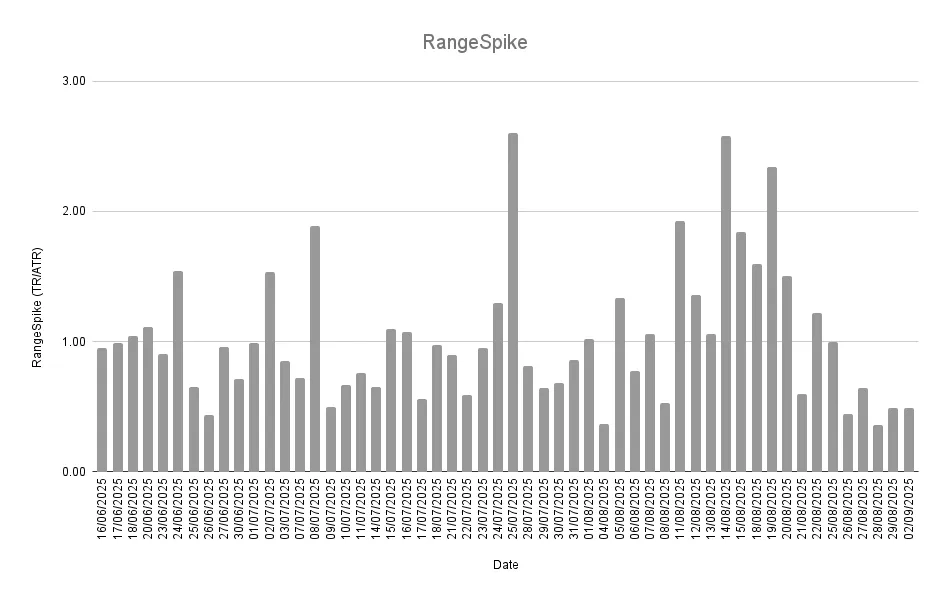
Interpretation
A RangeSpike of 1.0 simply means the day’s range was “average.” To find an edge, we must understand what constitutes a statistically rare range expansion while also considering recent distributions.
-
High Spikes: Our research in What’s the Ideal ATR Multiplier? shows that a RangeSpike of 1.8 or greater is a volatility event with a historically low probability of occurring (~4.5%)—making it the direct statistical equivalent of a 2.0 SigmaSpike. These spikes signal unusual urgency and are often the hallmark of a major trend initiation or a climactic reversal.
-
Low Spikes: An extremely low ratio (e.g., below 0.3) represents a profound lack of volatility. These are days where the market is coiling, building potential energy for its next significant move.
Analysis
We now have two distinct analytical tools: the SigmaSpike (focused on price returns) and the RangeSpike (focused on the price range). Both indicators serve to normalize volatility, but they do so from different angles.
Each indicator is fully capable of being a primary volatility watcher, depending on a trader’s style. However, additional insight can be gained by combining them into a single analytical tool and observing where they agree and, more importantly, where they diverge. This comparative analysis allows us to identify four “Volatility Signatures.”
- Decisive Conviction (High SigmaSpike + High RangeSpike) This occurs when the day’s final outcome and its intraday activity are aligned, often indicating a breakout or a strong trend day.
- Significant Indecision (Low SigmaSpike + High RangeSpike) Marked by a wide intraday range but little net change from the prior close. It reflects an unresolved struggle between buyers and sellers, typically found near key support or resistance levels, or at potential reversal points.
- The Quiet Trend (High SigmaSpike + Low RangeSpike) This represents a meaningful return achieved with minimal intraday fluctuation and indicates steady, one-sided control.
- Extreme Compression (Low SigmaSpike + Low RangeSpike) This occurs when both the final outcome and the intraday range are muted. It signals a market in a state of consolidation, often preceding a period of higher volatility.
Use Cases
Here are several ways VSIs can be applied in practice, both as standalone tools or in combination:
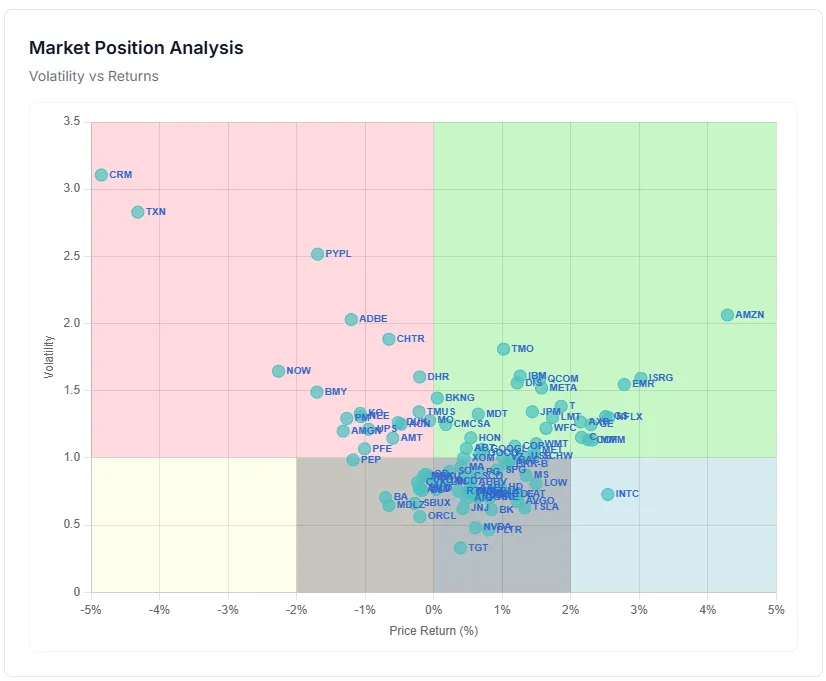
The Market Scatter Plot: The SigmaSpike and RangeSpike can be paired with price returns to visualize their relationship across an entire market using a scatter plot. As detailed in our article, Market Snapshot Scatter Plot, we can map each stock based on its daily return and its intraday volatility profile. This provides an immediate, at-a-glance assessment of the entire market’s character.
The Dynamic Watchlist: The indicators can be used to build a dynamic watchlist, allowing a trader to monitor price behavior to detect anomalies and generate daily trading ideas.
| Stock | SigmaSpike | RangeSpike | Volatility Signature |
|---|---|---|---|
| NVDA | 2.85 | 3.10 | Decisive Conviction |
| PFE | 0.04 | 2.95 | Significant Indecision |
| INTC | 3.15 | 1.10 | The Quiet Trend |
| JNJ | 0.08 | 0.21 | Extreme Compression |
Automated Filters & Alerts: For systematic traders, the logic from these indicators can be translated into an automated filtering and alert system, turning nuanced analysis into a scalable and repeatable process.
- Alert for “Significant Indecision”:
RangeSpike > 2.5ANDSigmaSpike < 0.5 - Filter for “Extreme Compression”:
RangeSpike < 0.3ANDSigmaSpike < 0.3 - Scan for “The Quiet Trend”:
SigmaSpike > 2.0ANDRangeSpike < 0.7
Market Note
The quality of your analysis is a direct result of the quality of your questions. Instead of asking the simple question, “Is the stock up or down?”, VSIs allow you to ask more nuanced questions:
- “How statistically significant was the day’s final verdict?”
- “How intense was the intraday auction?”
The answers provide a deeper, more objective understanding of market behavior, allowing you to focus on the handful of stocks that are telling a compelling story.
Happy Trading!