What’s the Ideal ATR Multiplier?
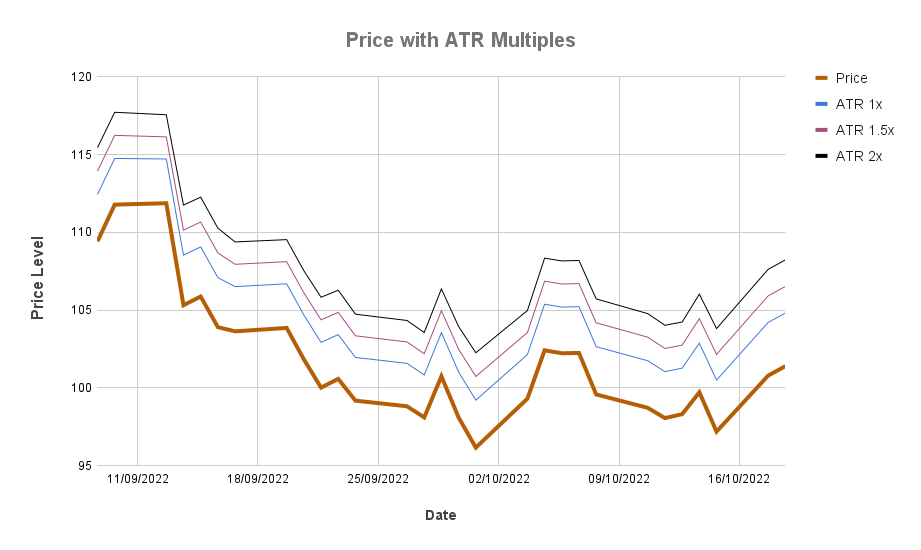
Many traders rely on ATR-based stop-losses , because they adjust to market volatility instead of sticking to arbitrary dollar or percentage levels. But even once you settle on using the Average True Range, there’s still one major lever to pull:
The Multiplier
The Multiplier is a scaling factor applied to the ATR to determine stop-loss distance. A larger multiplier gives trades more room by widening the stop, while a smaller one tightens it for a more aggressive risk profile. It’s essentially a tool for tailoring your stop-loss to both market volatility and your personal risk appetite.
 How do we determine what multiple to use?
Do you use the base ATR Value at 1x or 1.5x? 2x?
What’s too tight? What’s unnecessarily wide?
This post dives into that question with real back testing and data across the S&P 100 to move the conversation beyond opinion and into evidence.
Methodology at a Glance
The Research Question
What is the probability that the True Range (TR) will exceed the Average True Range (ATR) on a given trading day?
To test this, I used the True Range (TR) as the benchmark, since it captures the total price movement in a single day, including gaps. The methodology is based on the fact that if TR exceeds your ATR-based stop, you would have been stopped out.
The Formula
If TR > ATR x k , return (True); else (False). Where k is the ATR multiple.
This formula was then used to calculate the hit rate, which is defined as the percentage of days the True Range exceeded a specific multiple of the 14-day ATR.
The hit rate is calculated as follows:
Hit Rate (%) = ( Σ (TR > ATR × k) / Total Days Analysed ) × 100
The Dataset
-
Data: Daily prices for S&P 100 stocks
-
Period: 5 years
-
Data points: 124,100 (approx.)
-
ATR settings: 14-day ATR
-
Multipliers tested: From 1.0x to 2.0x in 0.1 increments
Analysis Summary
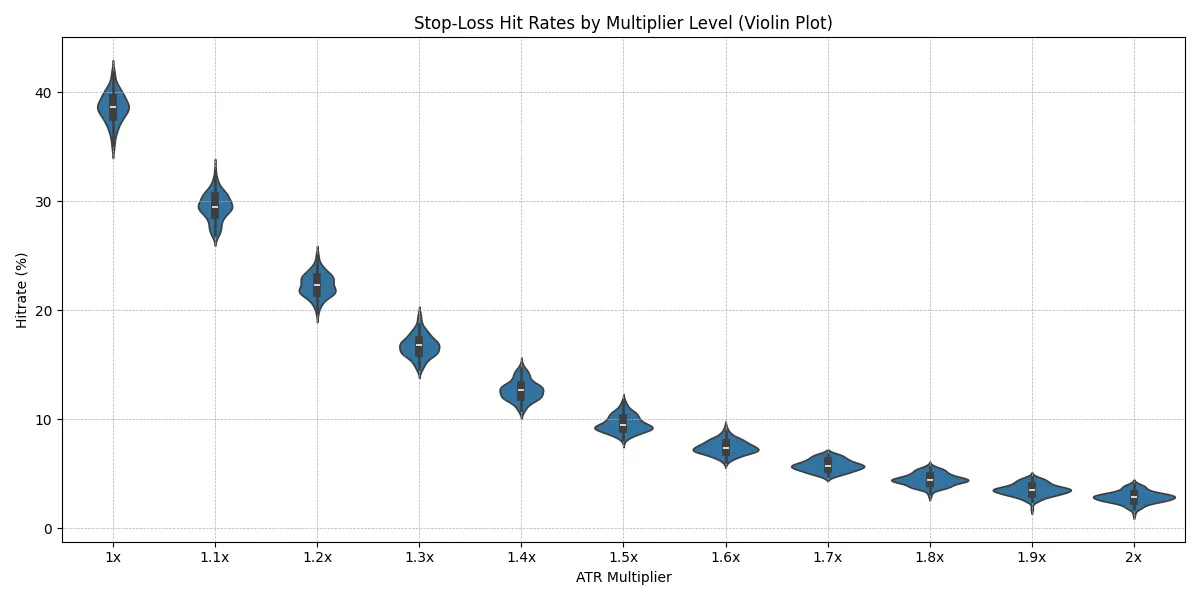
The violin plot above illustrates the distribution of hit rates across all tickers for each ATR multiplier.
The most prominent trend is the inverse relationship between the ATR multiplier and the hit rate: the hit rate decreases as the ATR multiplier increases. This aligns with the intuitive understanding that wider stop-losses (higher ATR multiples) are less likely to be triggered than tighter stop-losses (lower ATR multiples). This
The analysis yielded the following average hit rates for the ATR multipliers examined:
| Multiplier | Average Hit Rate (%) | Standard Deviation |
|---|---|---|
| 1.0x | 38.60 | 1.38 |
| 1.1x | 29.50 | 1.25 |
| 1.2x | 22.32 | 1.04 |
| 1.3x | 16.73 | 1.02 |
| 1.4x | 12.68 | 0.91 |
| 1.5x | 9.59 | 0.76 |
| 1.6x | 7.43 | 0.63 |
| 1.7x | 5.77 | 0.53 |
| 1.8x | 4.47 | 0.55 |
| 1.9x | 3.54 | 0.55 |
| 2.0x | 2.86 | 0.53 |
As the table illustrates, the average hit rate initially drops sharply. For example, increasing the ATR multiplier from 1.0x to 1.1x reduces the hit rate from 38.60% to 29.50%, a difference of 9.1%.
However, this effect diminishes as the multiplier increases. The decrease from 1.9x to 2.0x ATR is only 0.68% (3.54% – 2.86%).
This illustrates the principle of diminishing returns: widening our stop-loss is only beneficial up to a certain threshold. Beyond that, the added protection against premature stop-outs diminishes significantly, making further increases less impactful on the overall risk profile of the trade.
So What’s the Ideal ATR Multiplier?
That depends on your strategy. But thanks to this analysis, you can now make that choice with data and not guesswork.
-
If you trade fast breakouts or momentum pops, a 1.0x to 1.2x ATR stop may be tight but purposeful. You’re accepting more frequent stop-outs in exchange for discipline and tighter loss control.
-
If you’re riding broader trends or trading volatile names, something in the 1.4x to 1.6x ATR range may give the trade more breathing room—without opening the door to unnecessary losses.
The key insight? Every decimal of the multiplier changes your exposure, and that shift is measurable. This isn’t theoretical it’s tested. It’s quantifiable. It’s something you can build into your edge.
Happy Trading!